01 Overview
Dashboard &
Data Visualization
Full Stack · Enterprise SaaS
A year-long full stack design and development project at Bank of America Merrill Lynch, building an internal SaaS dashboard from the ground up to automate operational reporting and surface real-time intelligence across global business lines.
My Role
Full stack design and development: collecting and analyzing data from multiple sources, designing the interface, and building both front-end and back-end systems.
Outcome
A production SaaS dashboard providing real-time event volumes, automation success rates, and noise patterns with role-specific views for leadership and operations teams.
Impact
Replaced manual, outdated reporting with live automated intelligence, enabling faster decisions across the global command center transformation program.
02 Stakeholders
Role-Based Requirements
The dashboard needed to serve three distinct user groups, each with different levels of detail and different operational goals. Requirements were gathered from each stakeholder group to define tailored views and reporting capabilities.
CTO / Senior Leadership
- Real-time alerts summary and automation performance overview
- Business line performance with leader visibility
- Year-over-year and month-over-month trend analysis
- Weekly report extraction and raw data download
Line of Business Managers
- Daily and monthly performance for their specific business line
- Customizable views scoped to their team
Automation Team Managers
- Email alerts when events flood
- 7-day flood history by infrastructure and application
- Alert attributes with downloadable custom reports
- Automation success rates and failure summaries
03 Design
From Data to Interface
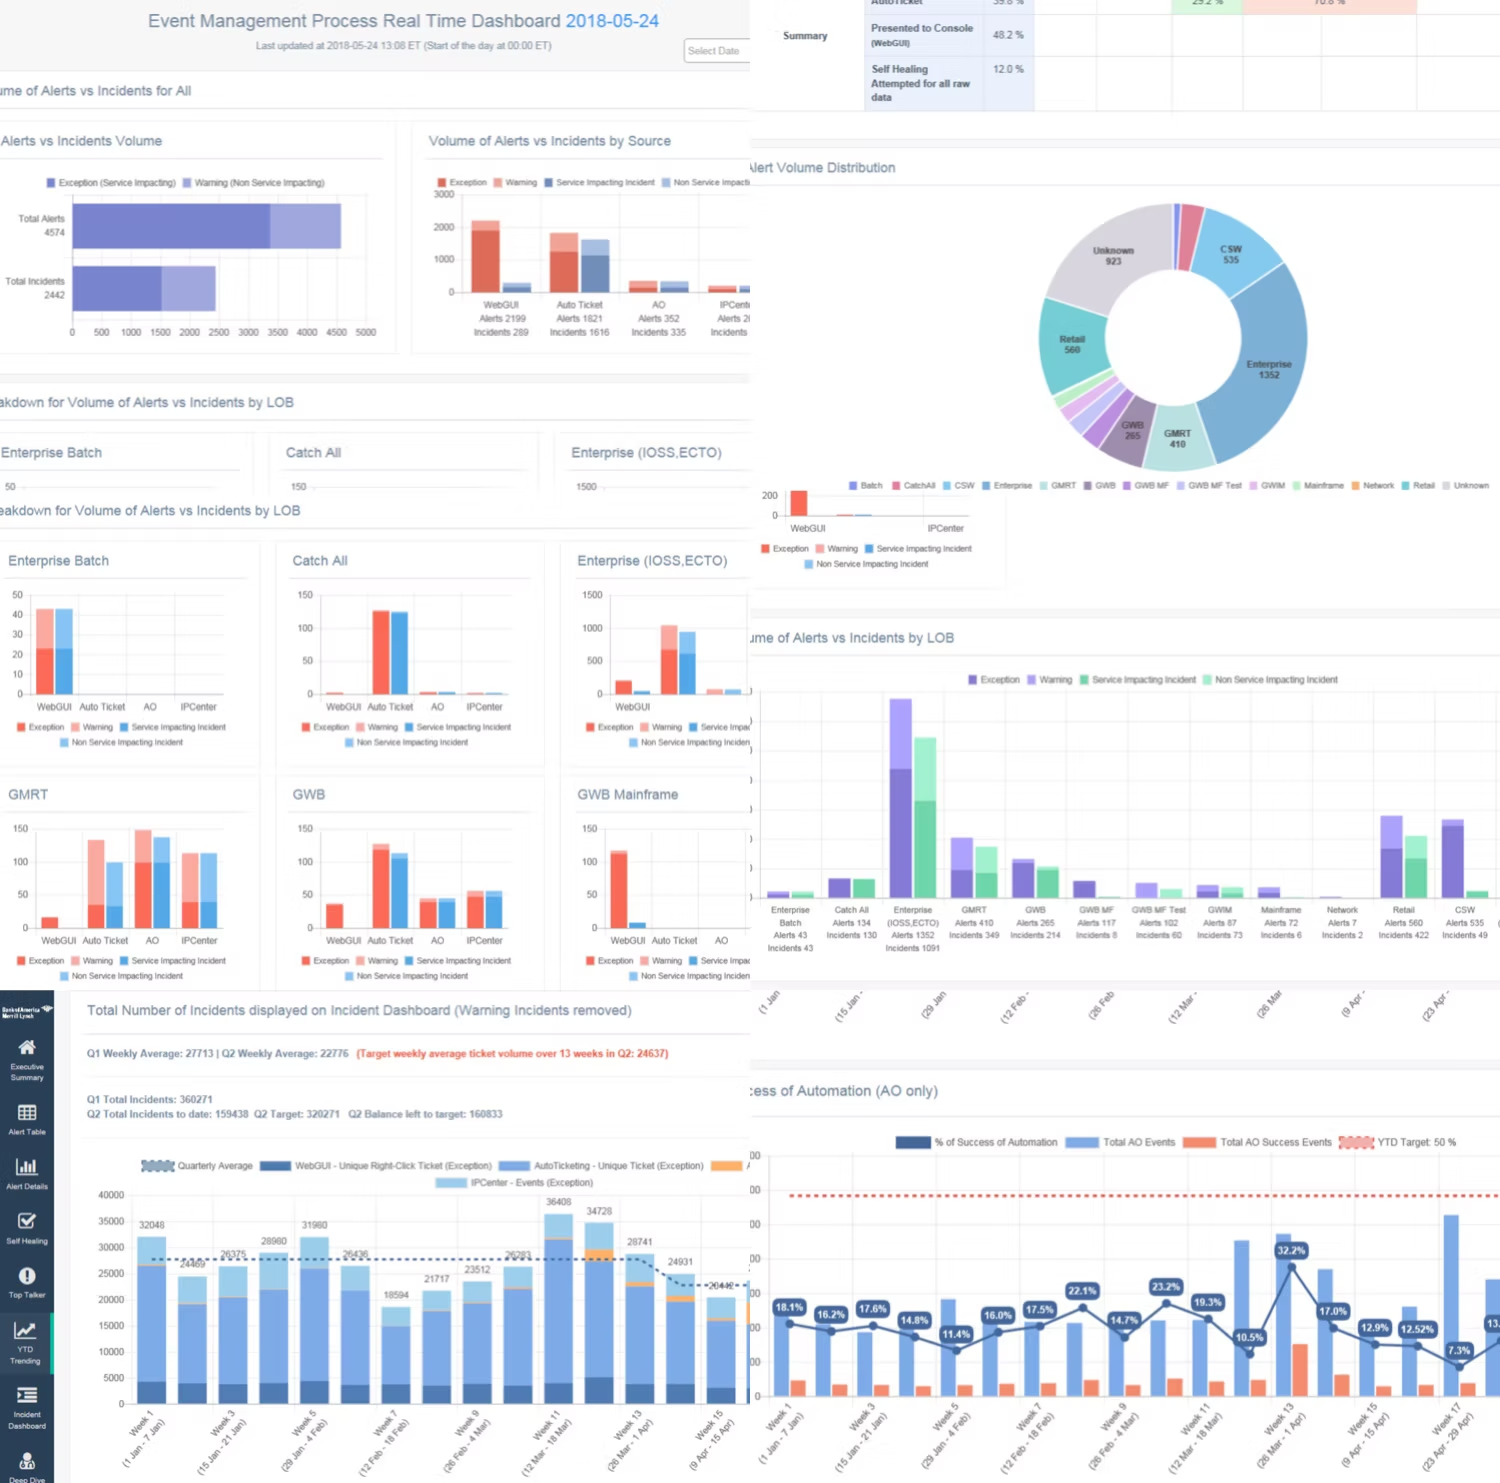
The design process began with mapping data sources and defining what each stakeholder needed to see at a glance versus on demand. The focus was on interactive, intuitive visualizations that made complex operational data immediately readable.
Real-Time Volumes
Live event and incident counts visualized across business lines, updated without page refresh.
Automation Rates
Success and failure rates tracked per automation with drill-down into failure summaries.
Noise & Flood Detection
7-day flood history surfaced with infrastructure and application attribution for quick triage.
Role-Based Views
Each user type sees a tailored layout scoped to their responsibilities, reducing cognitive load.
04 Prototype
Built and Shipped
Both front-end and back-end were developed in full, integrating multiple data sources and databases into a unified pipeline. The emphasis was on performance and clarity: real data flowing into interactive, role-specific visualizations.
05 Summary & Impact
Replacing Manual Reporting with Live Intelligence
The Event Management Dashboard was deployed as part of a broader transformation program to build a more intelligent, next-generation global command center. By replacing outdated manual reports with automated, real-time data, operational teams gained the visibility to act faster and with greater confidence.
Automation
Operational reporting fully automated, eliminating manual data pulls and stale weekly summaries.
Accessibility
Complex multi-source data made accessible to non-technical stakeholders through clear visual design.
Scalability
Architecture built to support multiple business lines and user roles from a single data pipeline.