01 Overview
Ford Energy
Services
Mobile App
EVs sit idle 94% of the time. Ford Energy Services turns that idle time into savings, grid resilience, and peace of mind. All automatically.
Role
UI/UX designer and front-end developer in Phase 1. Design lead in Phase 2.
Scope
EnergyKit research prototype → production-ready designs for Ford Pilot Programs → Ford Energy Rewards launch.
Outcome
Shipped nationally with utility partners. EV owners earning $300–$1,200/year in charging incentives.
02 The Challenge
Redefining how customers manage home and vehicle energy
The goal was clear: empower EV owners across three dimensions. Financial savings, energy education, and home security. But reaching that goal meant untangling six deeply interconnected barriers sitting between what customers wanted and what Ford and its utility partners needed.
Customer goals
- Save money on electricity & charging costs
- Charge without worry or peak-hour stress
- Keep the home powered during outages
- Reduce their carbon footprint
Design challenges
Ford + Utility goals
- Grid stability & peak demand reduction
- EV ecosystem growth & utility partnerships
- Recurring customer engagement
- National scale without lock-in
How do you build trust in automation when users have low energy literacy, inconsistent habits, and real skepticism about battery impact?
03 Phase 1: EnergyKit
A functional prototype to measure real behavior
Instead of static mockups, we built EnergyKit: a fully functional web-app prototype integrated with real vehicle data: plug-in status, charging metrics, and power usage. This let us measure actual interaction behavior, not just stated preferences.
My role in Phase 1
UI/UX Design
Created the initial concept and drove multiple design explorations for the EnergyKit app.
Front-end Development
Built CSS layouts, JavaScript data visualizations, and the scheduling UI.
User Research
Collaborated directly with researchers in multiple rounds of user interviews. Also produced the customer onboarding video to introduce participants to the EnergyKit prototype.
The experiment design
14 Mach-E Early Access Program owners across 10 U.S. states participated in a 2-week live experiment in December 2022.
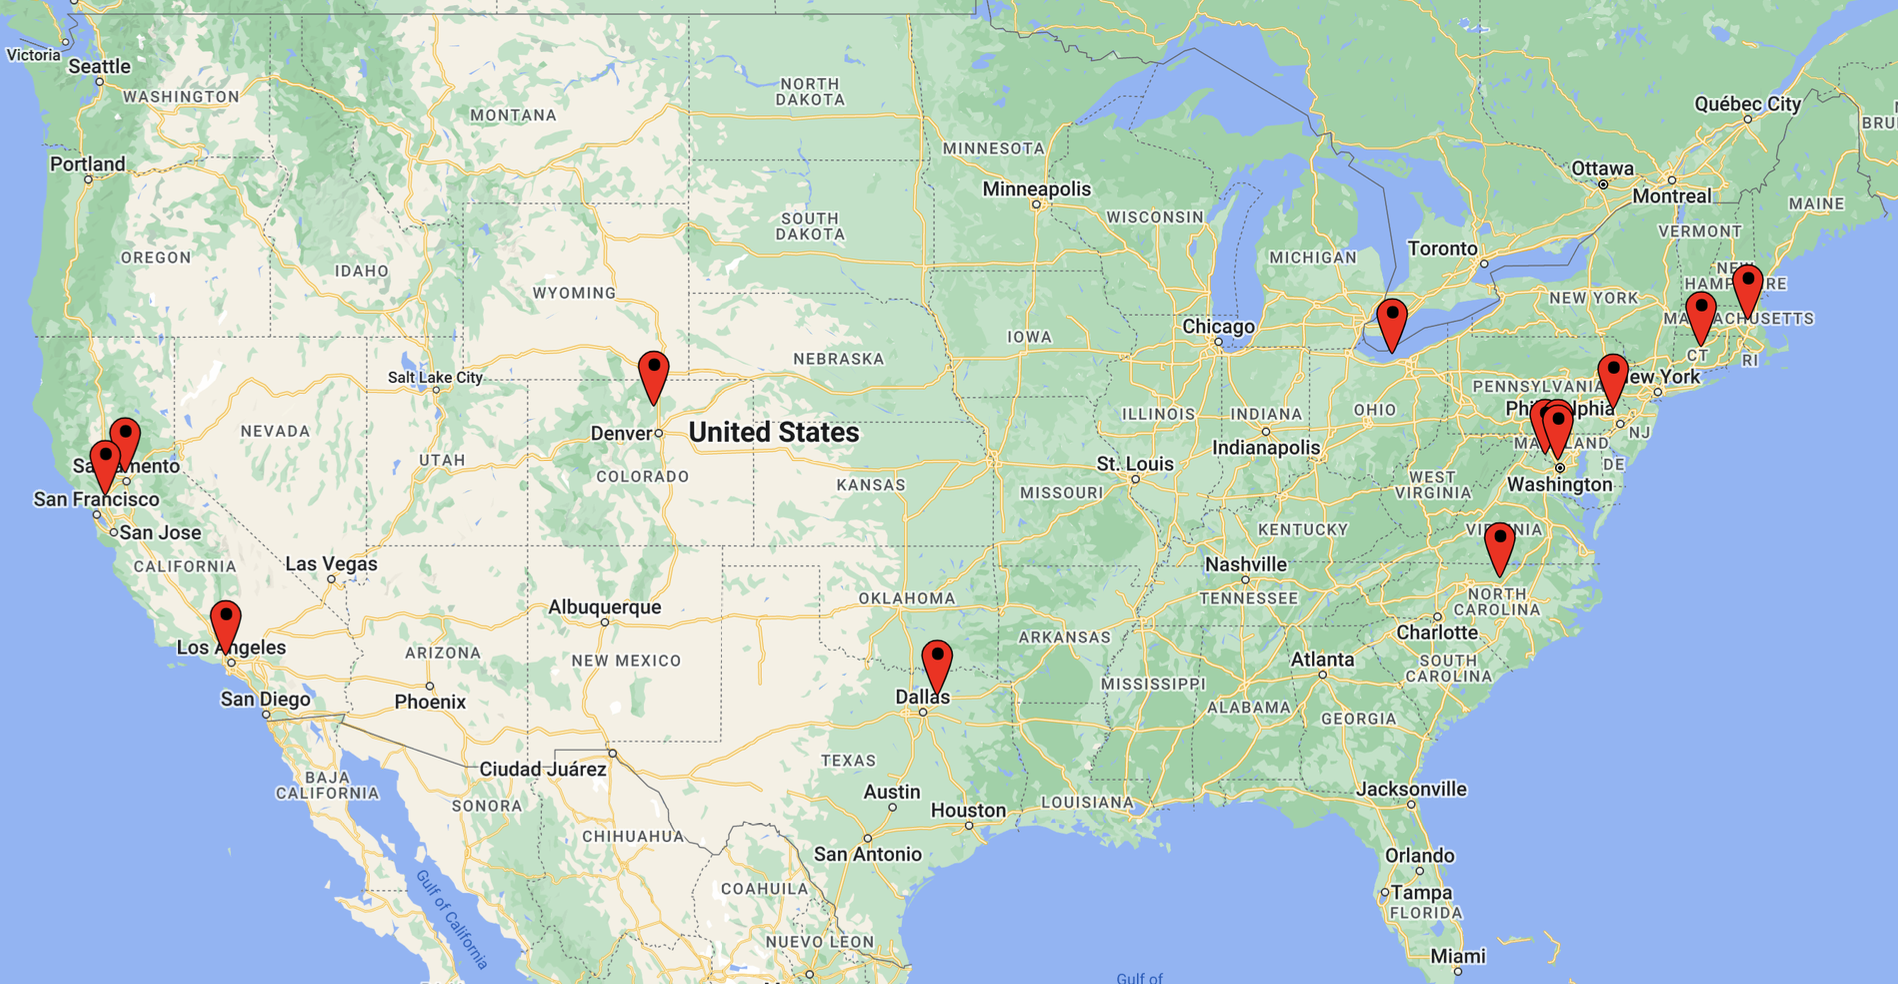
Group A · n=7
Full app with energy flow
- Real-time color-coded energy flow diagram
- Live status of vehicle, charger, and home
- Future charging schedule visible
Group B · n=7
App without energy flow
- Same automation and controls
- Same scheduling and reporting
- No real-time energy visualization
Hypothesis: energy flow visualization drives higher trust and perceived value in the automated system.
Research methods
Co-creation Sessions
Design workshops with early Mach-E owners to surface needs and mental models.
Userzoom Assessments
Unmoderated prototype testing to capture behavior at scale without moderator bias.
In-Context Exploration
Participants used the prototype in real home environments over two weeks.
Live Behavioral Data
Tracked page visits, time on screen, plug-in frequency, and automation opt-outs in real time.
Data visualizations
I designed and built all data visualization screens in JavaScript using Chart.js. These four modals gave users a personal impact summary while also acting as research instruments: we tracked which pages users clicked into most, directly informing our findings on what customers actually care about.
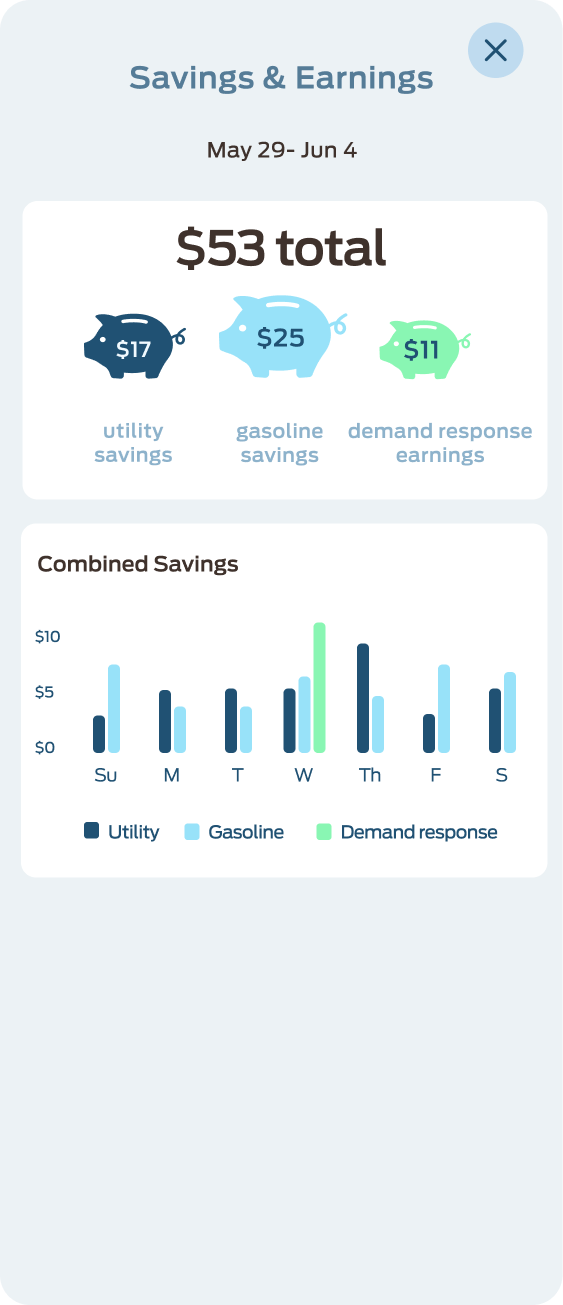
Savings & Earnings
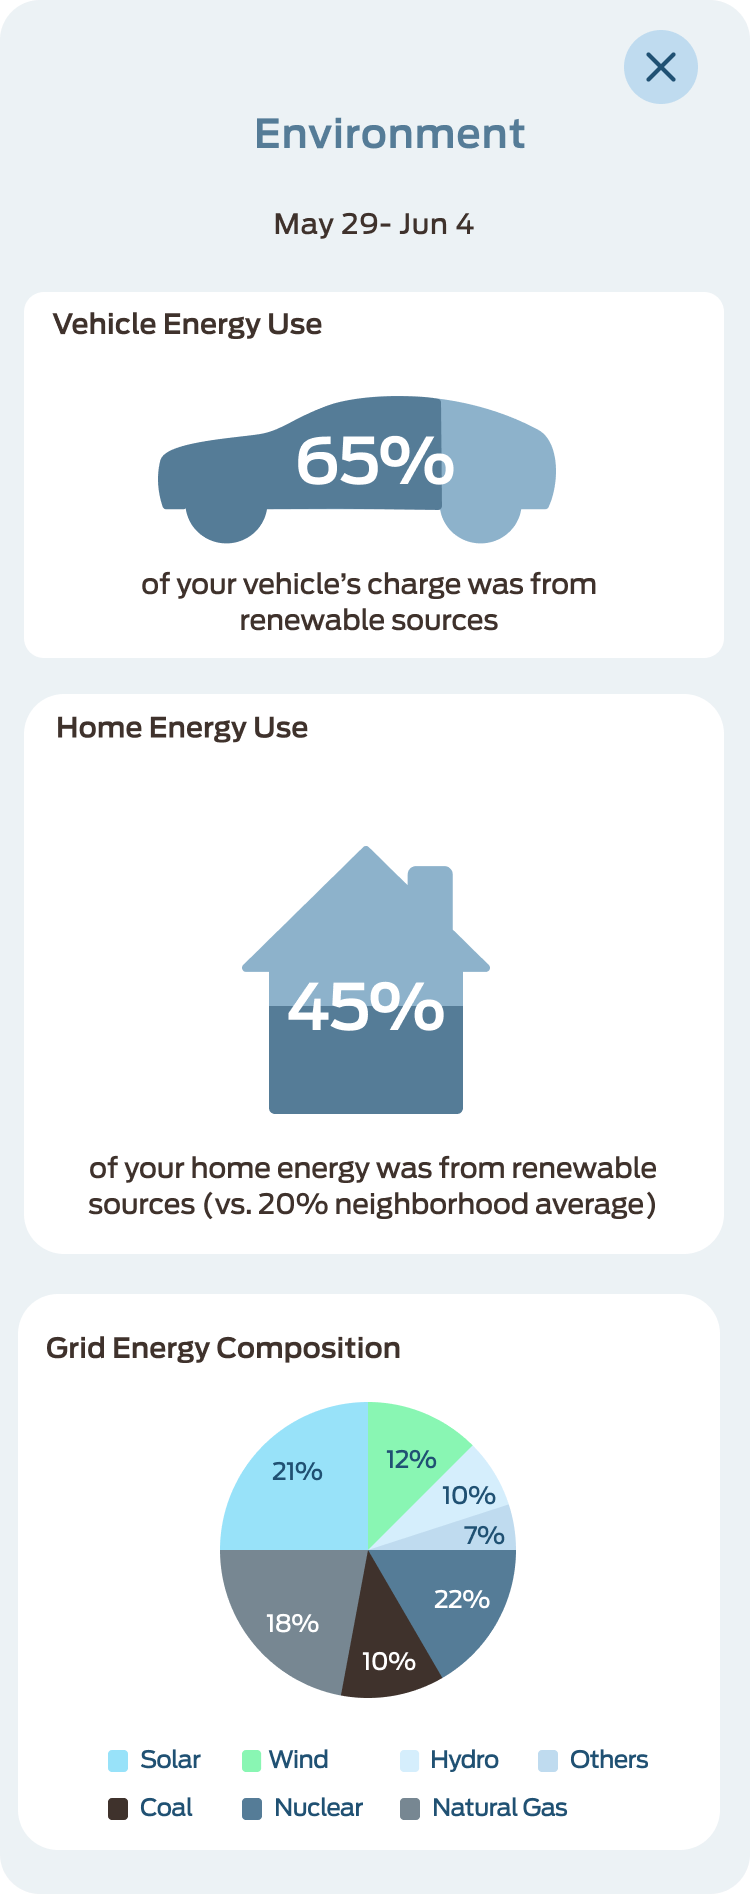
Environment
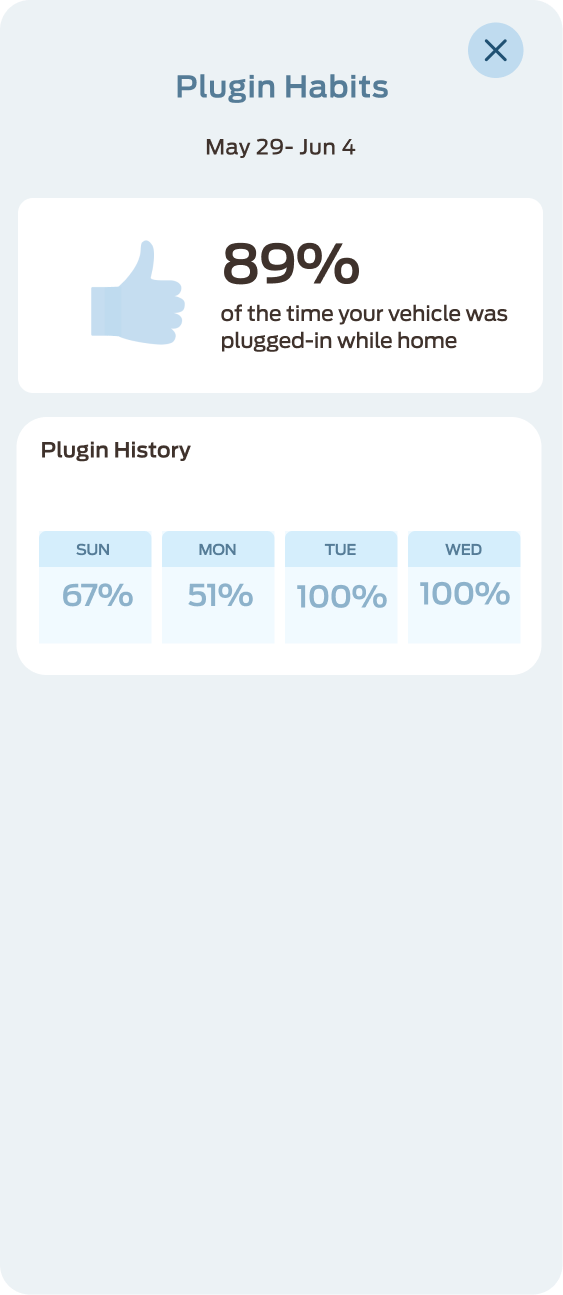
Plugin Habits
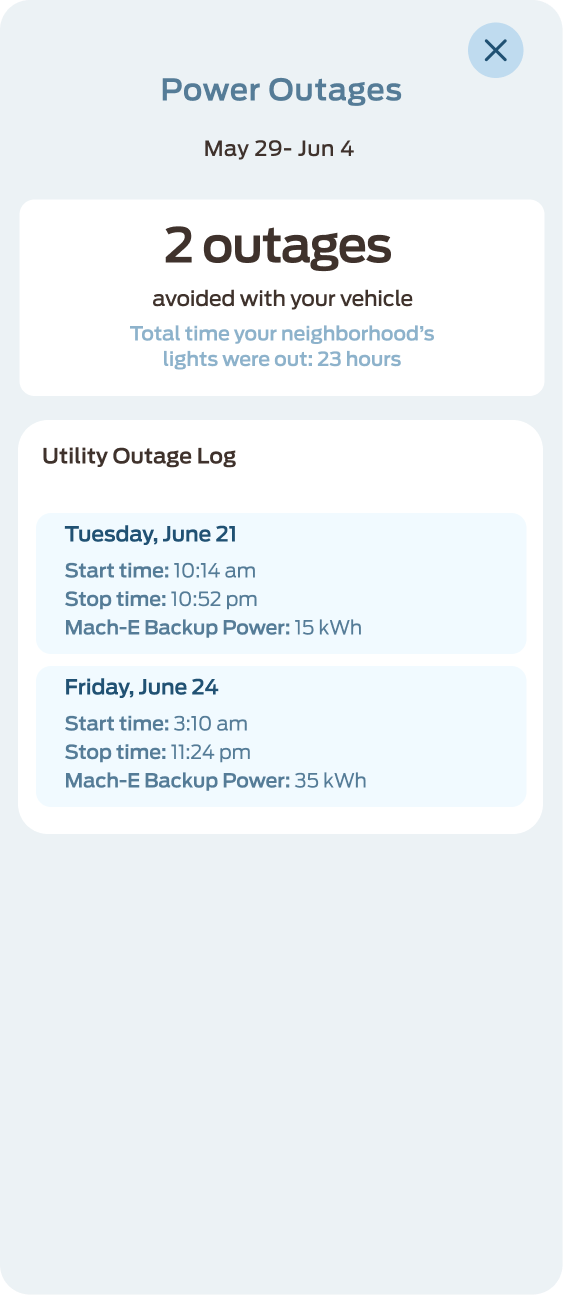
Power Outages
04 Key Insights
What EV owners taught us about energy and trust
Three motivations drive EV ownership: early adopter pride, pragmatic environmentalism, and growing interest in bi-directional capability. But the behaviors that matter for energy services were more nuanced.
Users spent twice as long on savings reports as on environmental reports. Financial framing consistently outperformed eco messaging.
followed plug-in schedules, yet only 20% responded to plug-in reminders
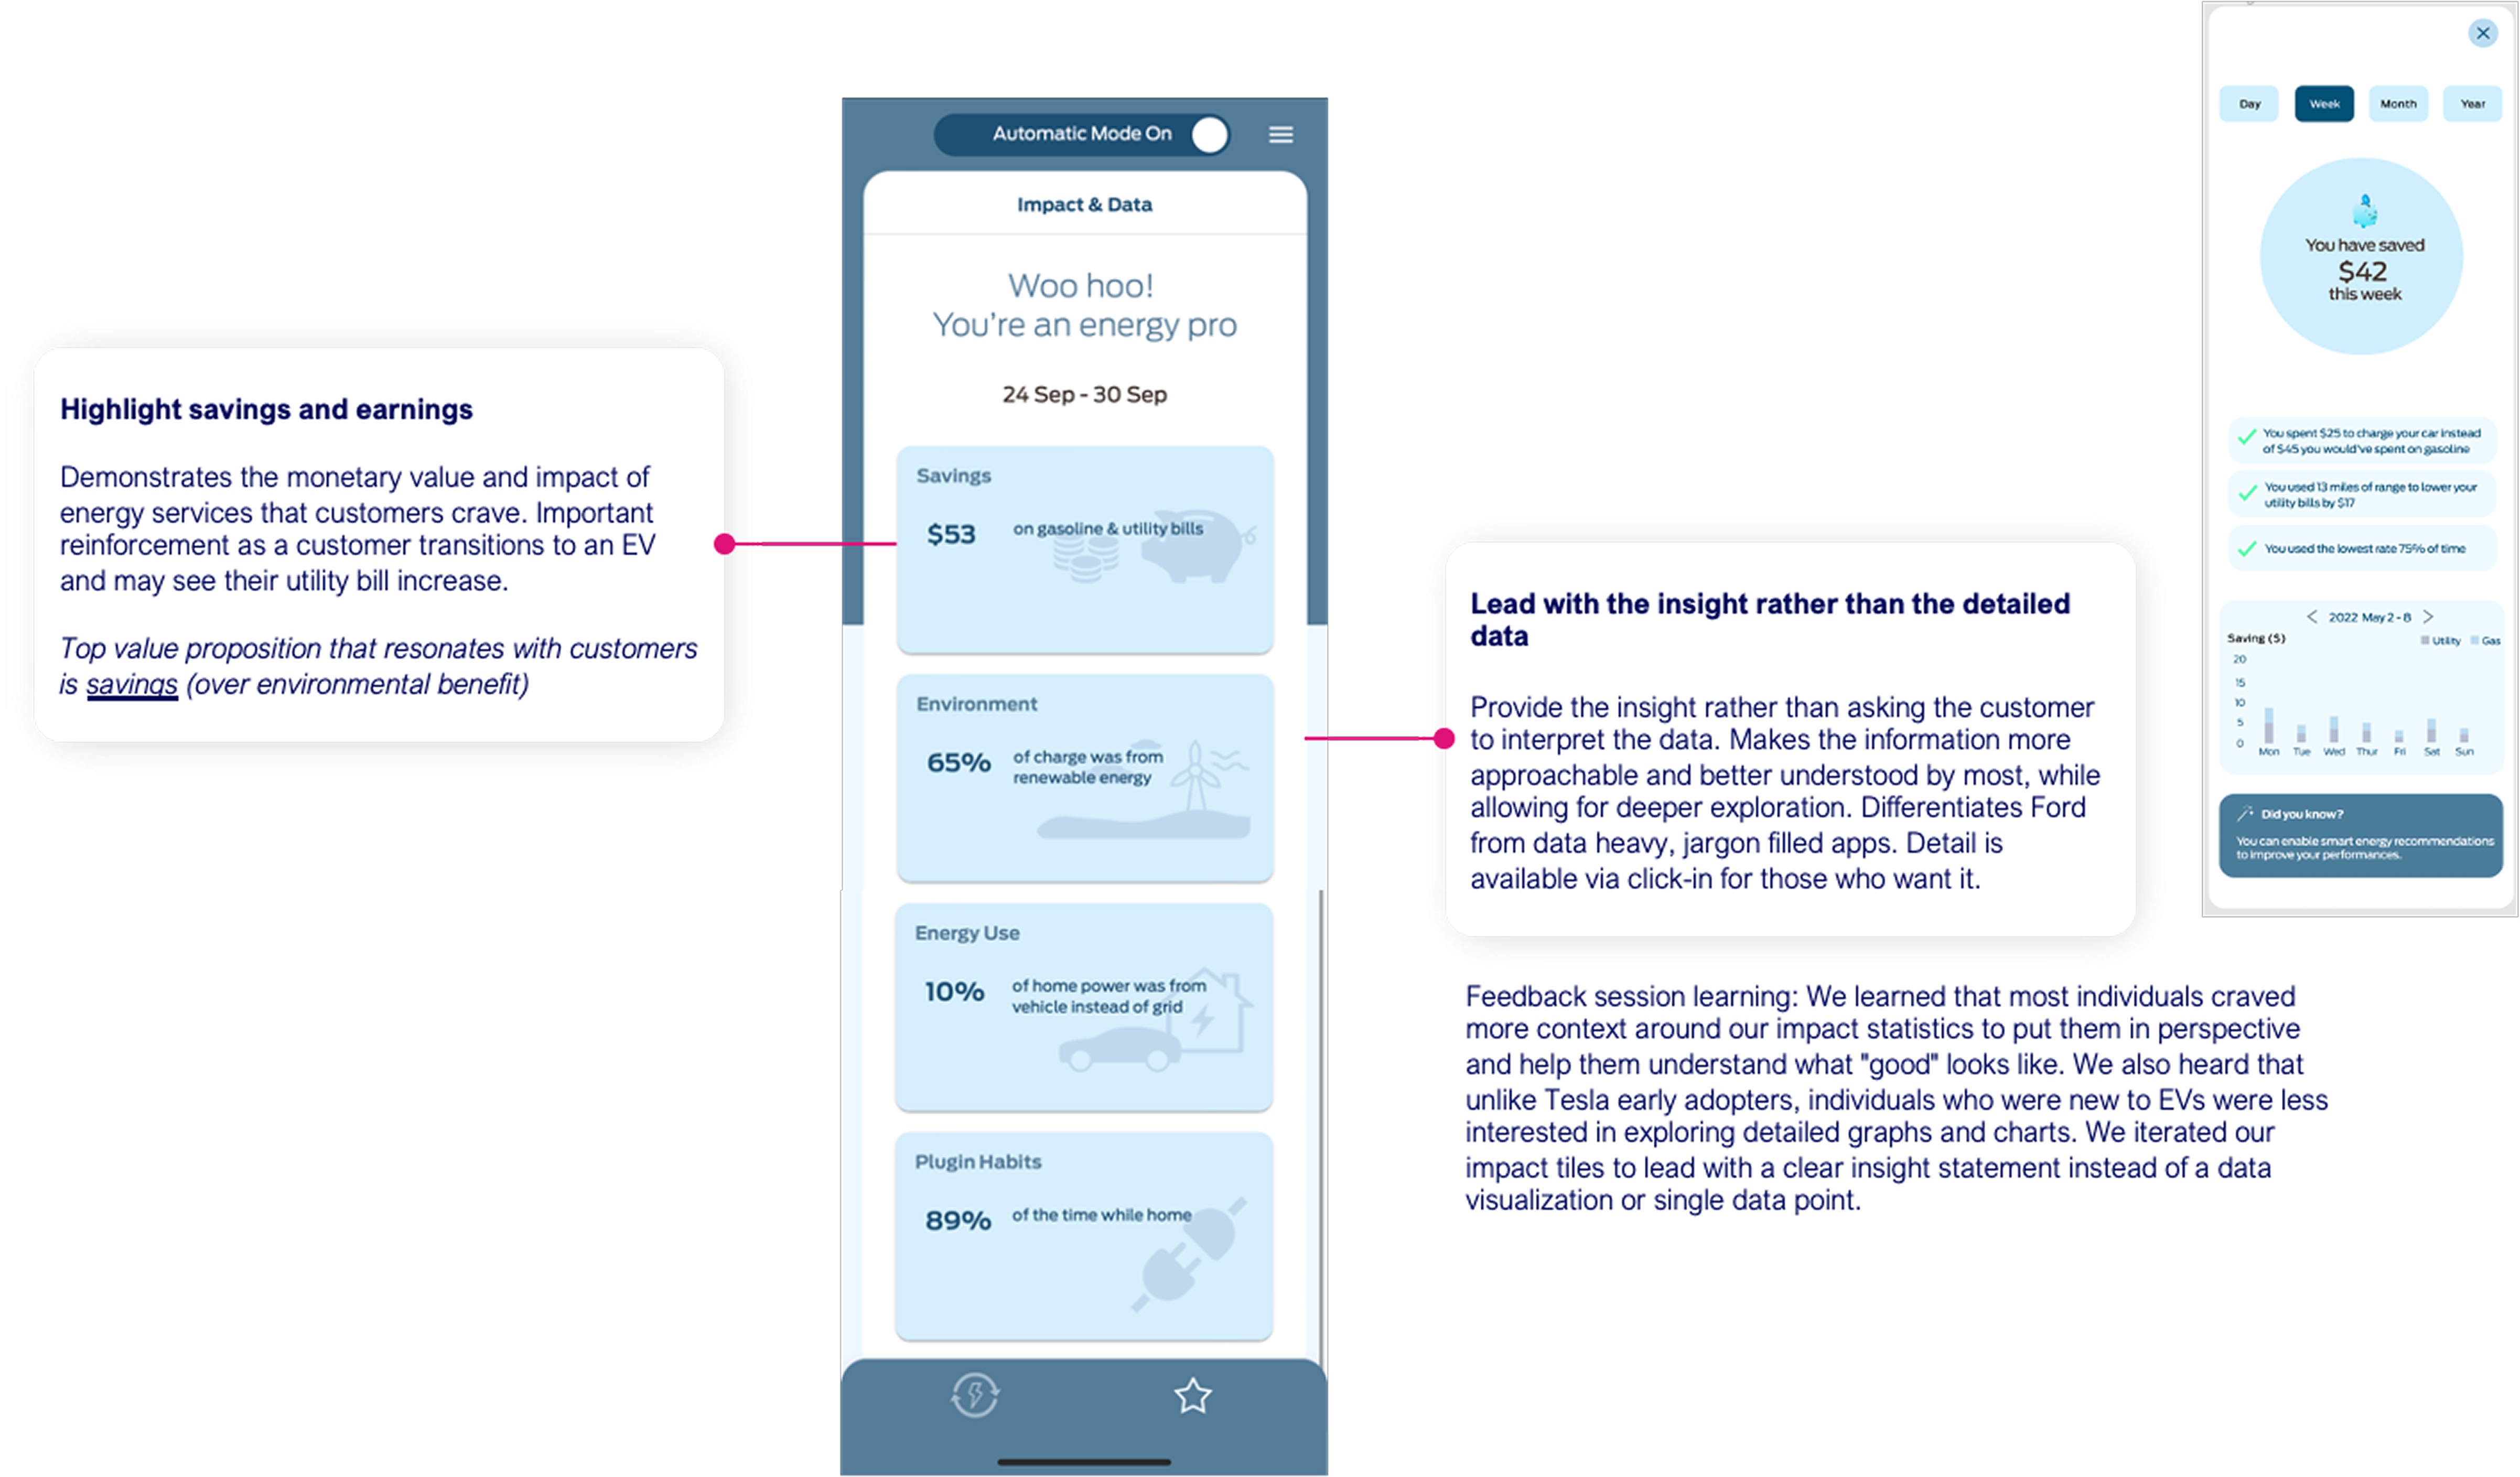
more time spent on impact summaries than detailed data pages. Lead with the headline.
opt-outs across 2 weeks. Almost no one needed to override, but everyone wanted the option.
Passive engagement is the goal
Engagement peaks early as users verify the system works, then declines as trust builds. Declining usage = success.
"Ford has the right to do it. They know the vehicle, they know how charging works."
Ford's position as vehicle manufacturer outperformed tech companies on trust. Customers felt Ford had earned the right to manage their battery, an advantage no third-party app could match.
"This savings report gives me bragging rights amongst my gas-guzzling friends." Damon L.
Experiment results
Trust out of 7
Perceived Value out of 7
The energy flow diagram meaningfully boosts perceived value (+1.5 pts) with a modest trust improvement (+0.5 pts). Hypothesis partially validated.
"I checked the app more in the beginning to make sure it wouldn't malfunction, but after it proved the vehicle was always fully charged, I just let it run." Zach C.
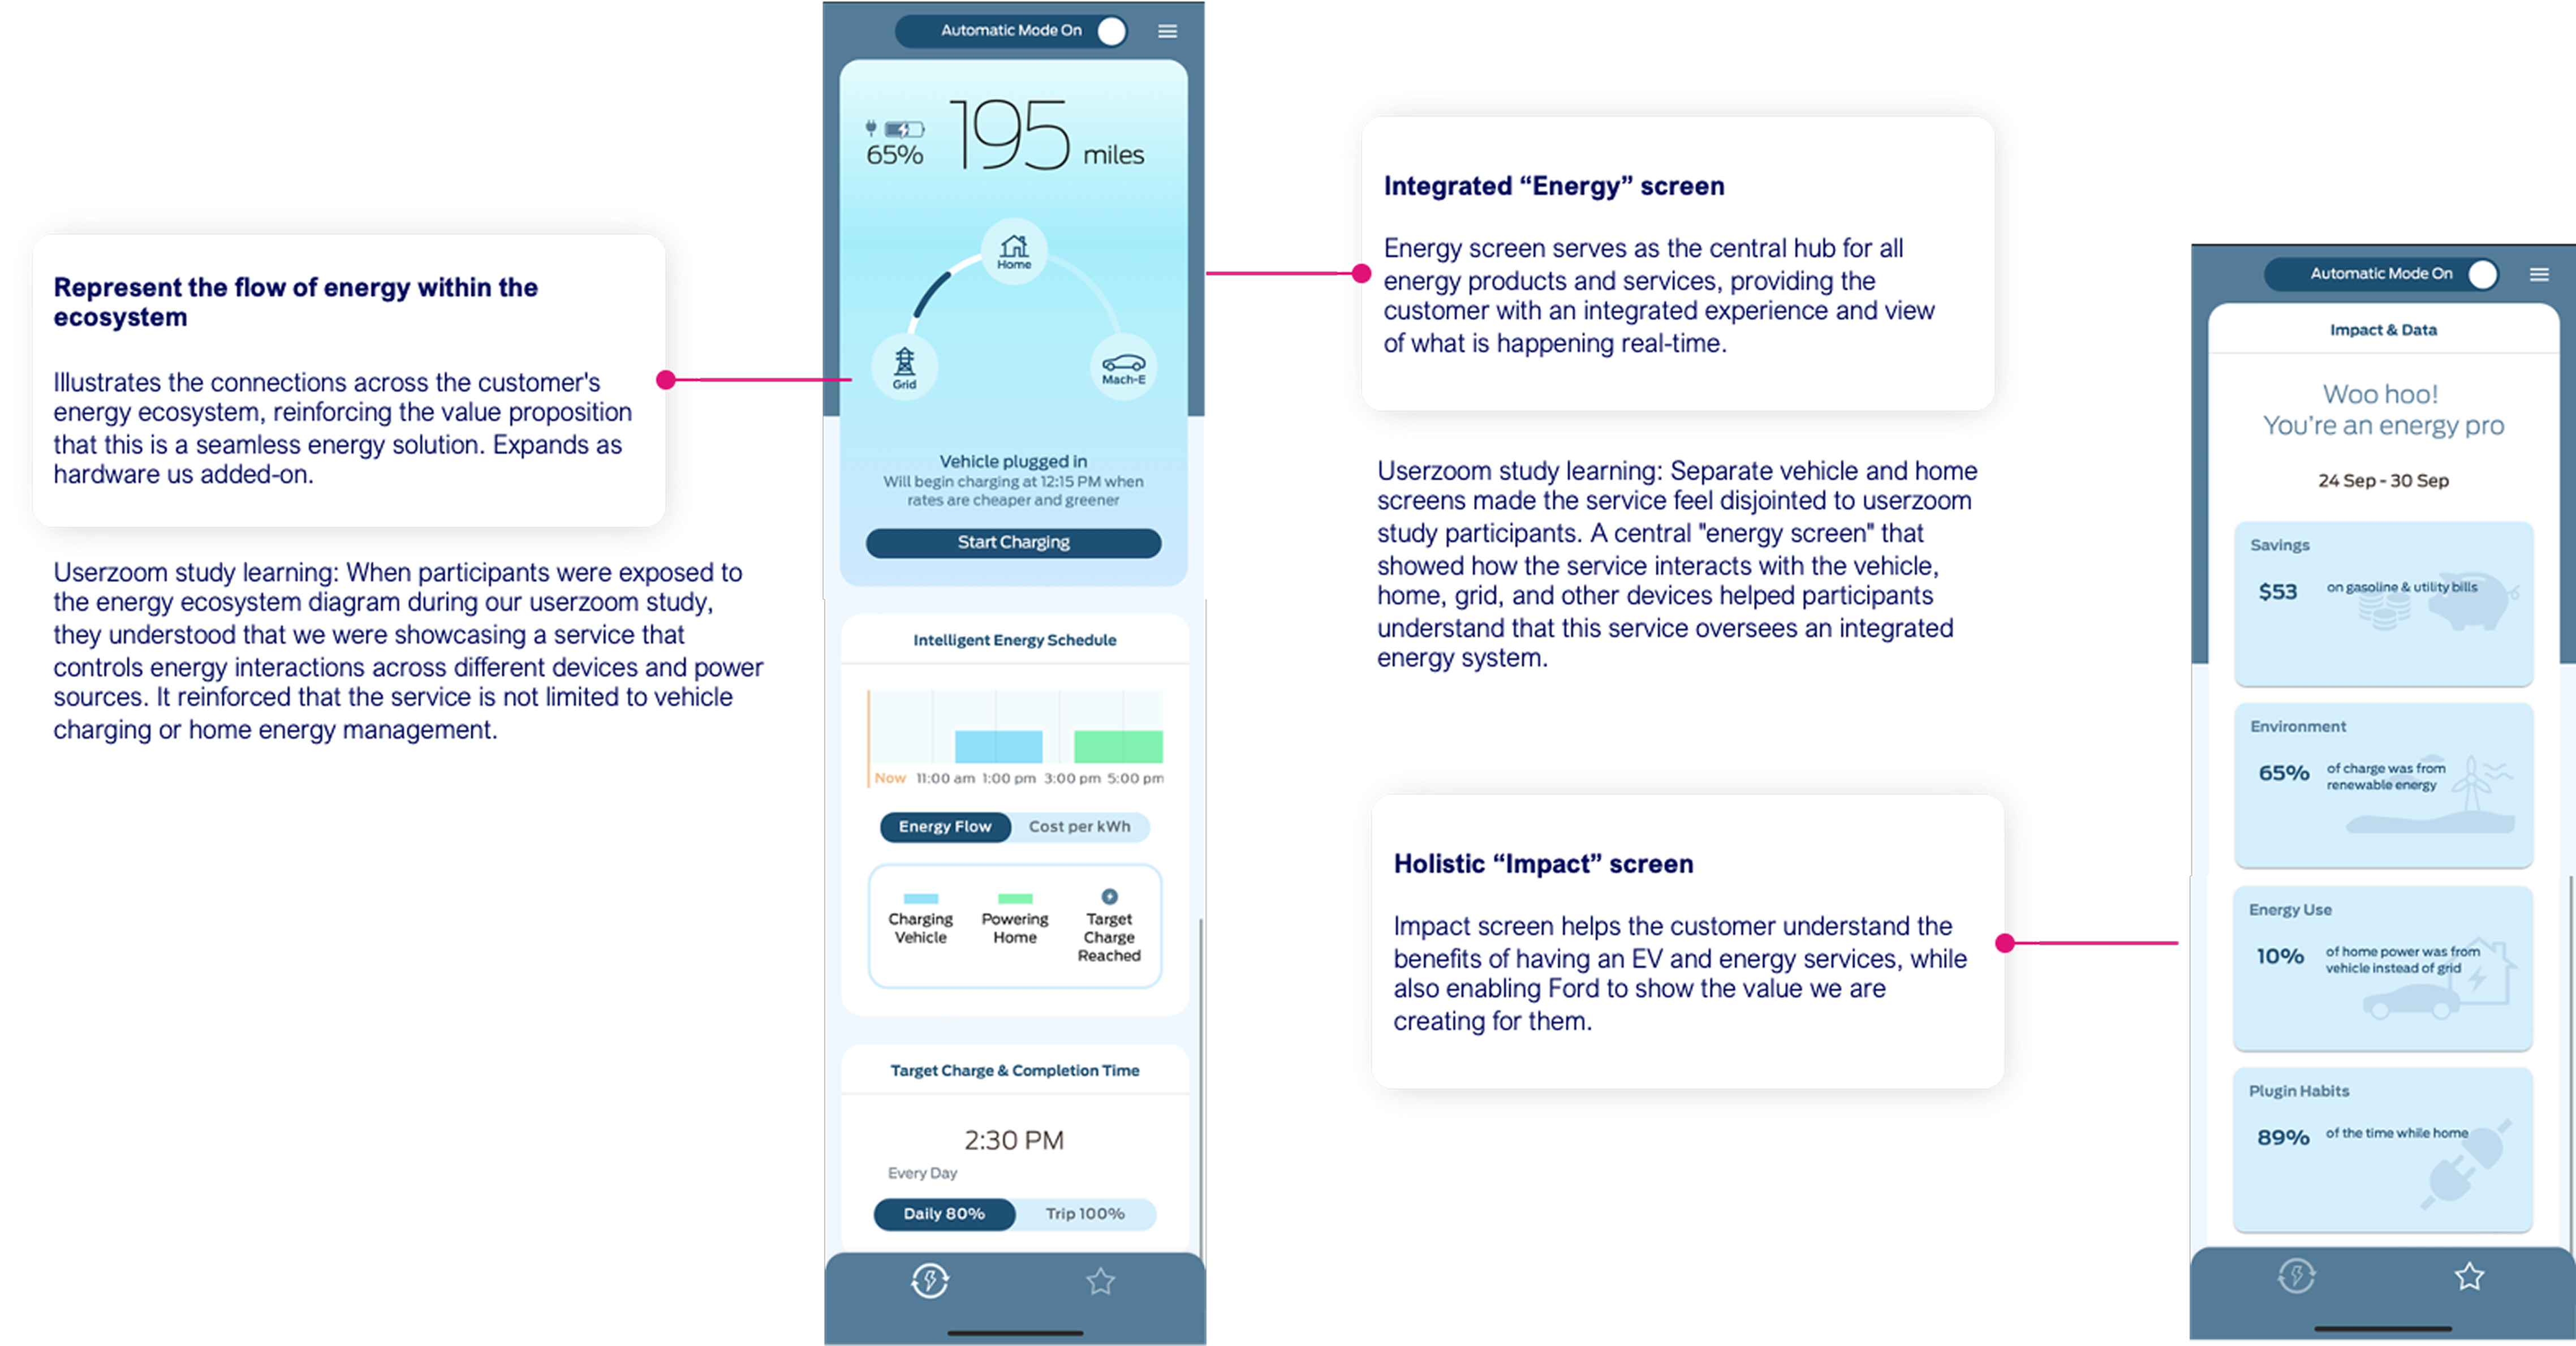
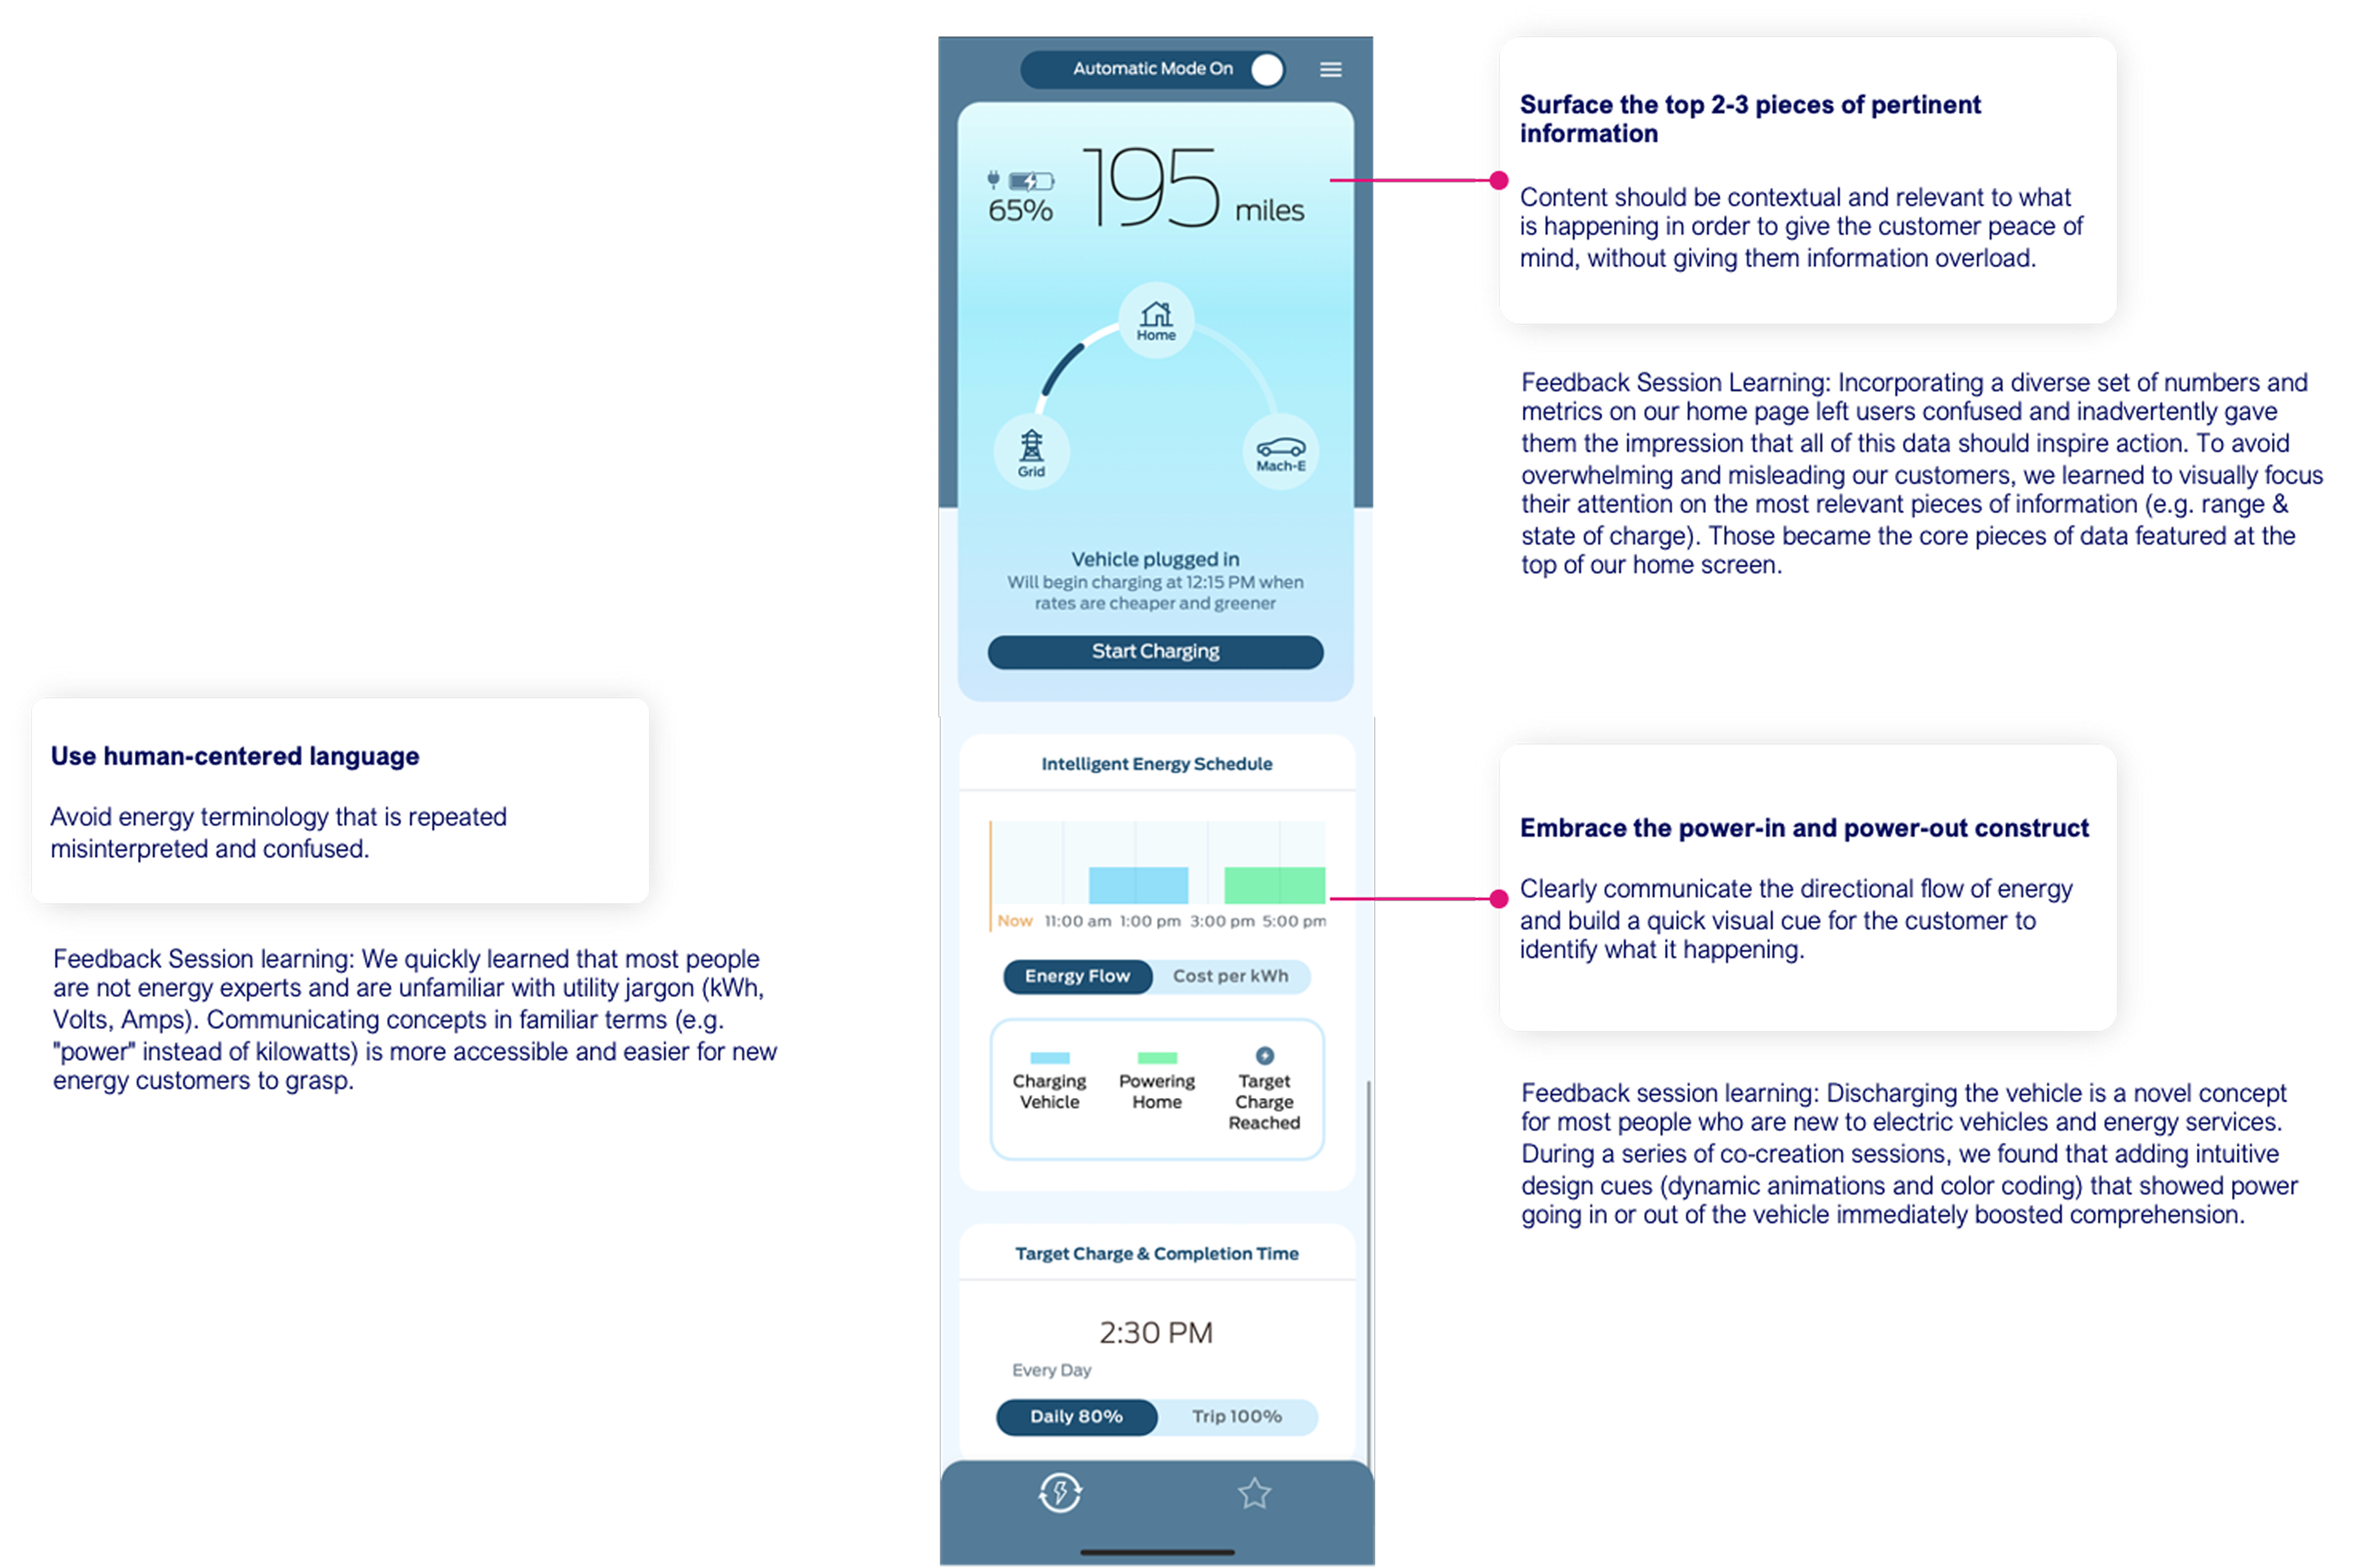
05 Design Principles
Six Design Principles
EnergyKit research helped us define the constraints. These six principles guided every Phase 2 design decision from first sketch to production handoff.
Design for a novice, not an expert
Simple enough for anyone to participate. No energy expertise required. Ever.
Build for an ecosystem
Energy products appear integrated and consistent. Easily expandable to solar, V2H, and V2G as technology matures.
Automate to reduce cognitive load
Set it and forget it. Customers interact on their own terms, not the system's schedule.
Build trust through transparency
Show the right amount of information at the right moment. Not less (anxiety), not more (overwhelm).
Lead with human-centered insights
Compelling summaries over dense data. The goal is a feeling backed by a fact, not a dashboard.
Inspire pride and delight
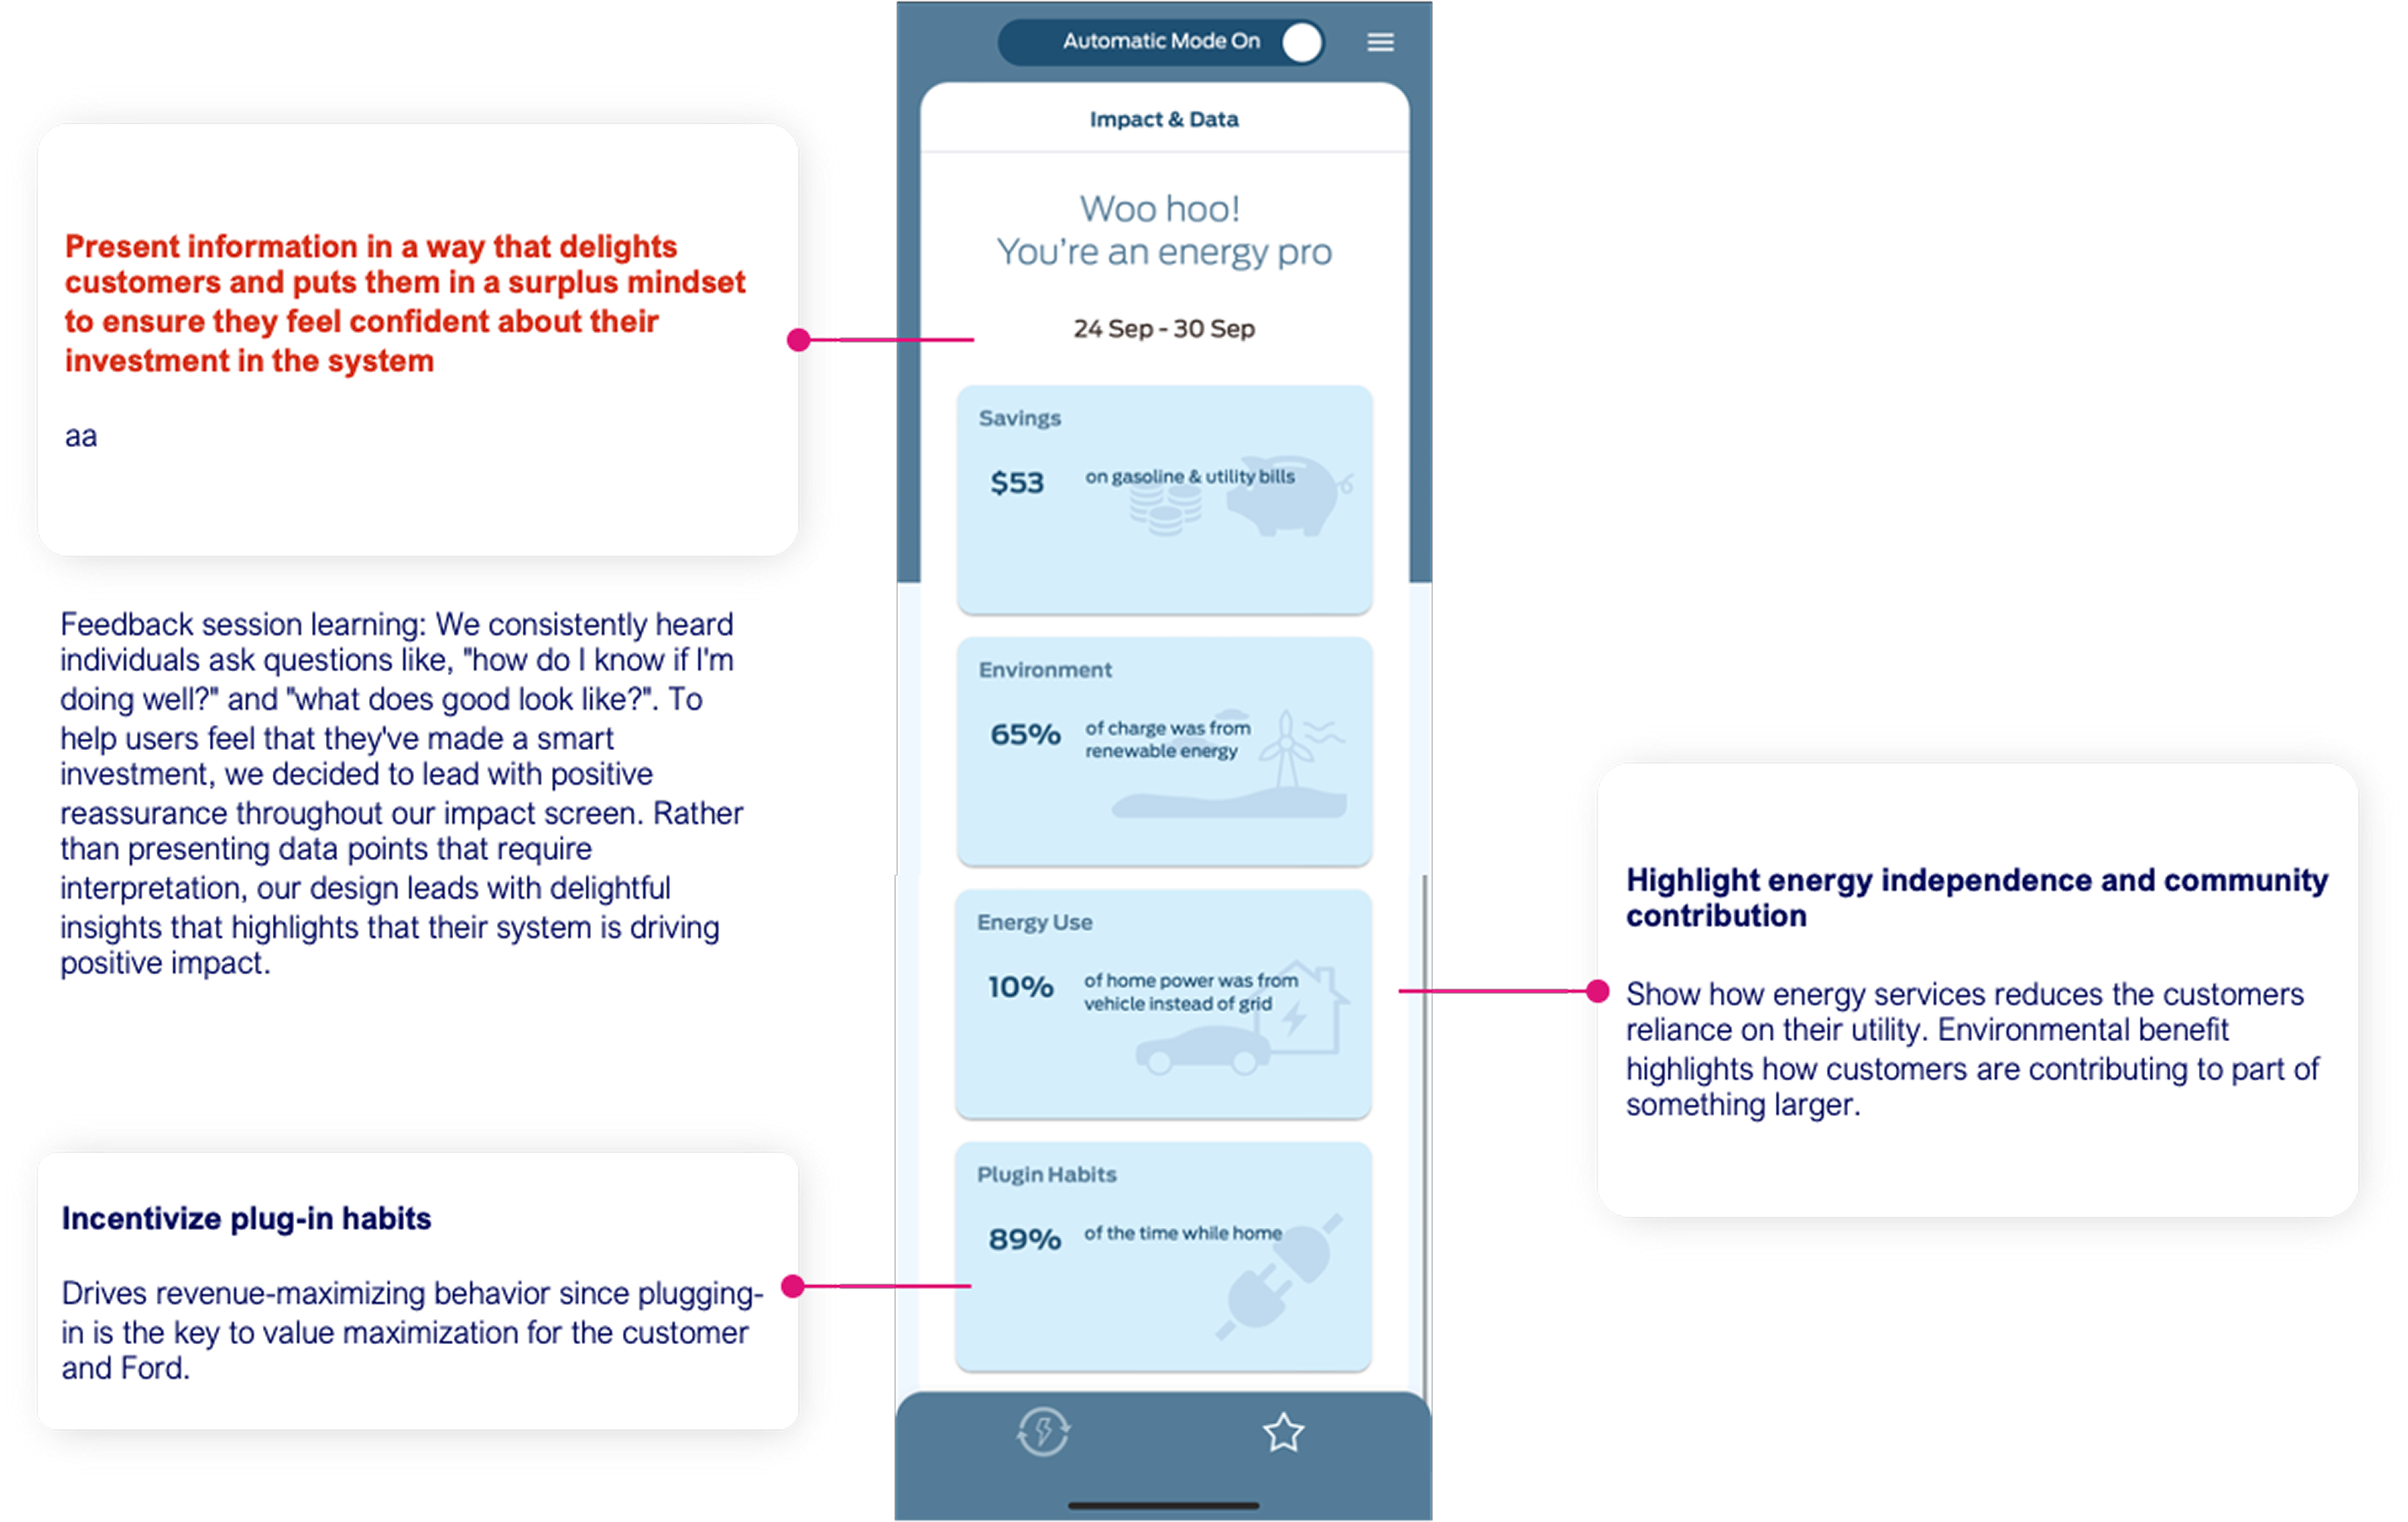
Show customers their smart investment is paying off: in money, in grid contribution, in EV ownership pride.
06 Phase 2: Energy Services App
From prototype to production
As design lead for Phase 2 UI/UX, I took the EnergyKit findings and translated them into production-ready design. I led the UX flows, refined the visual components through multiple rounds of real customer testing, and collaborated directly with engineers for handoff across Ford Pilot Programs including Grid Service and Intelligent Power.
Three UX pillars
Peace of Mind
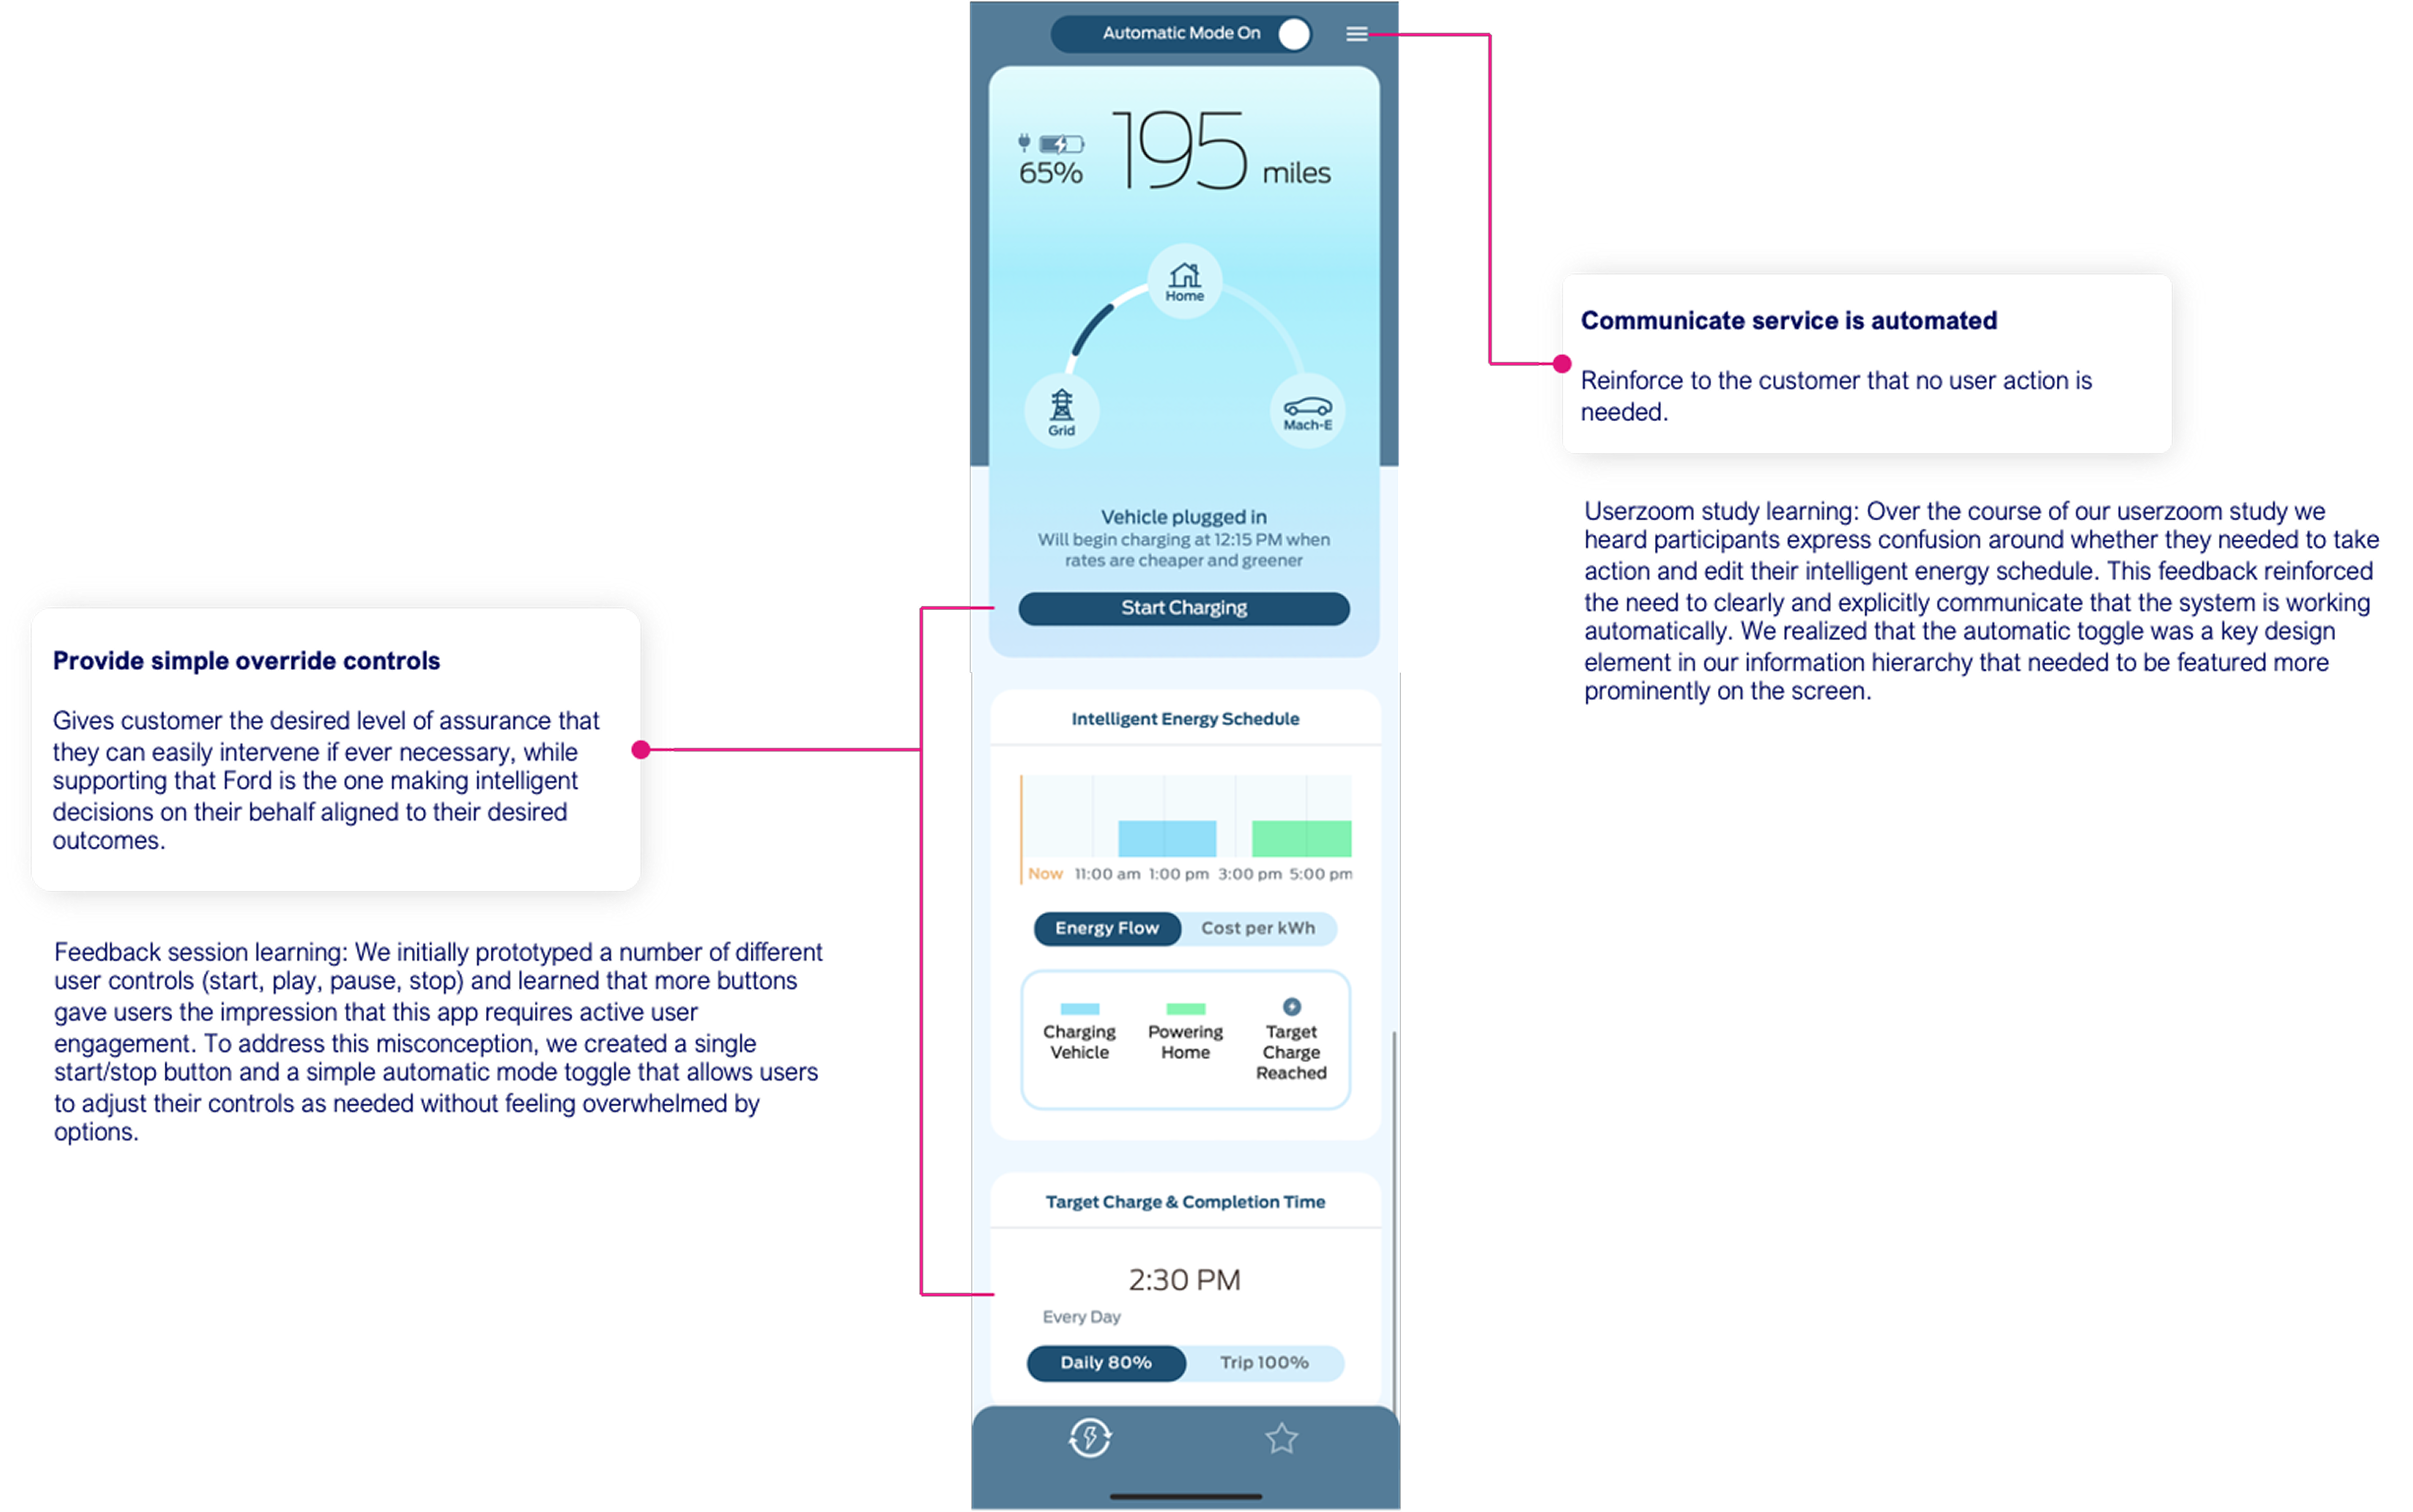
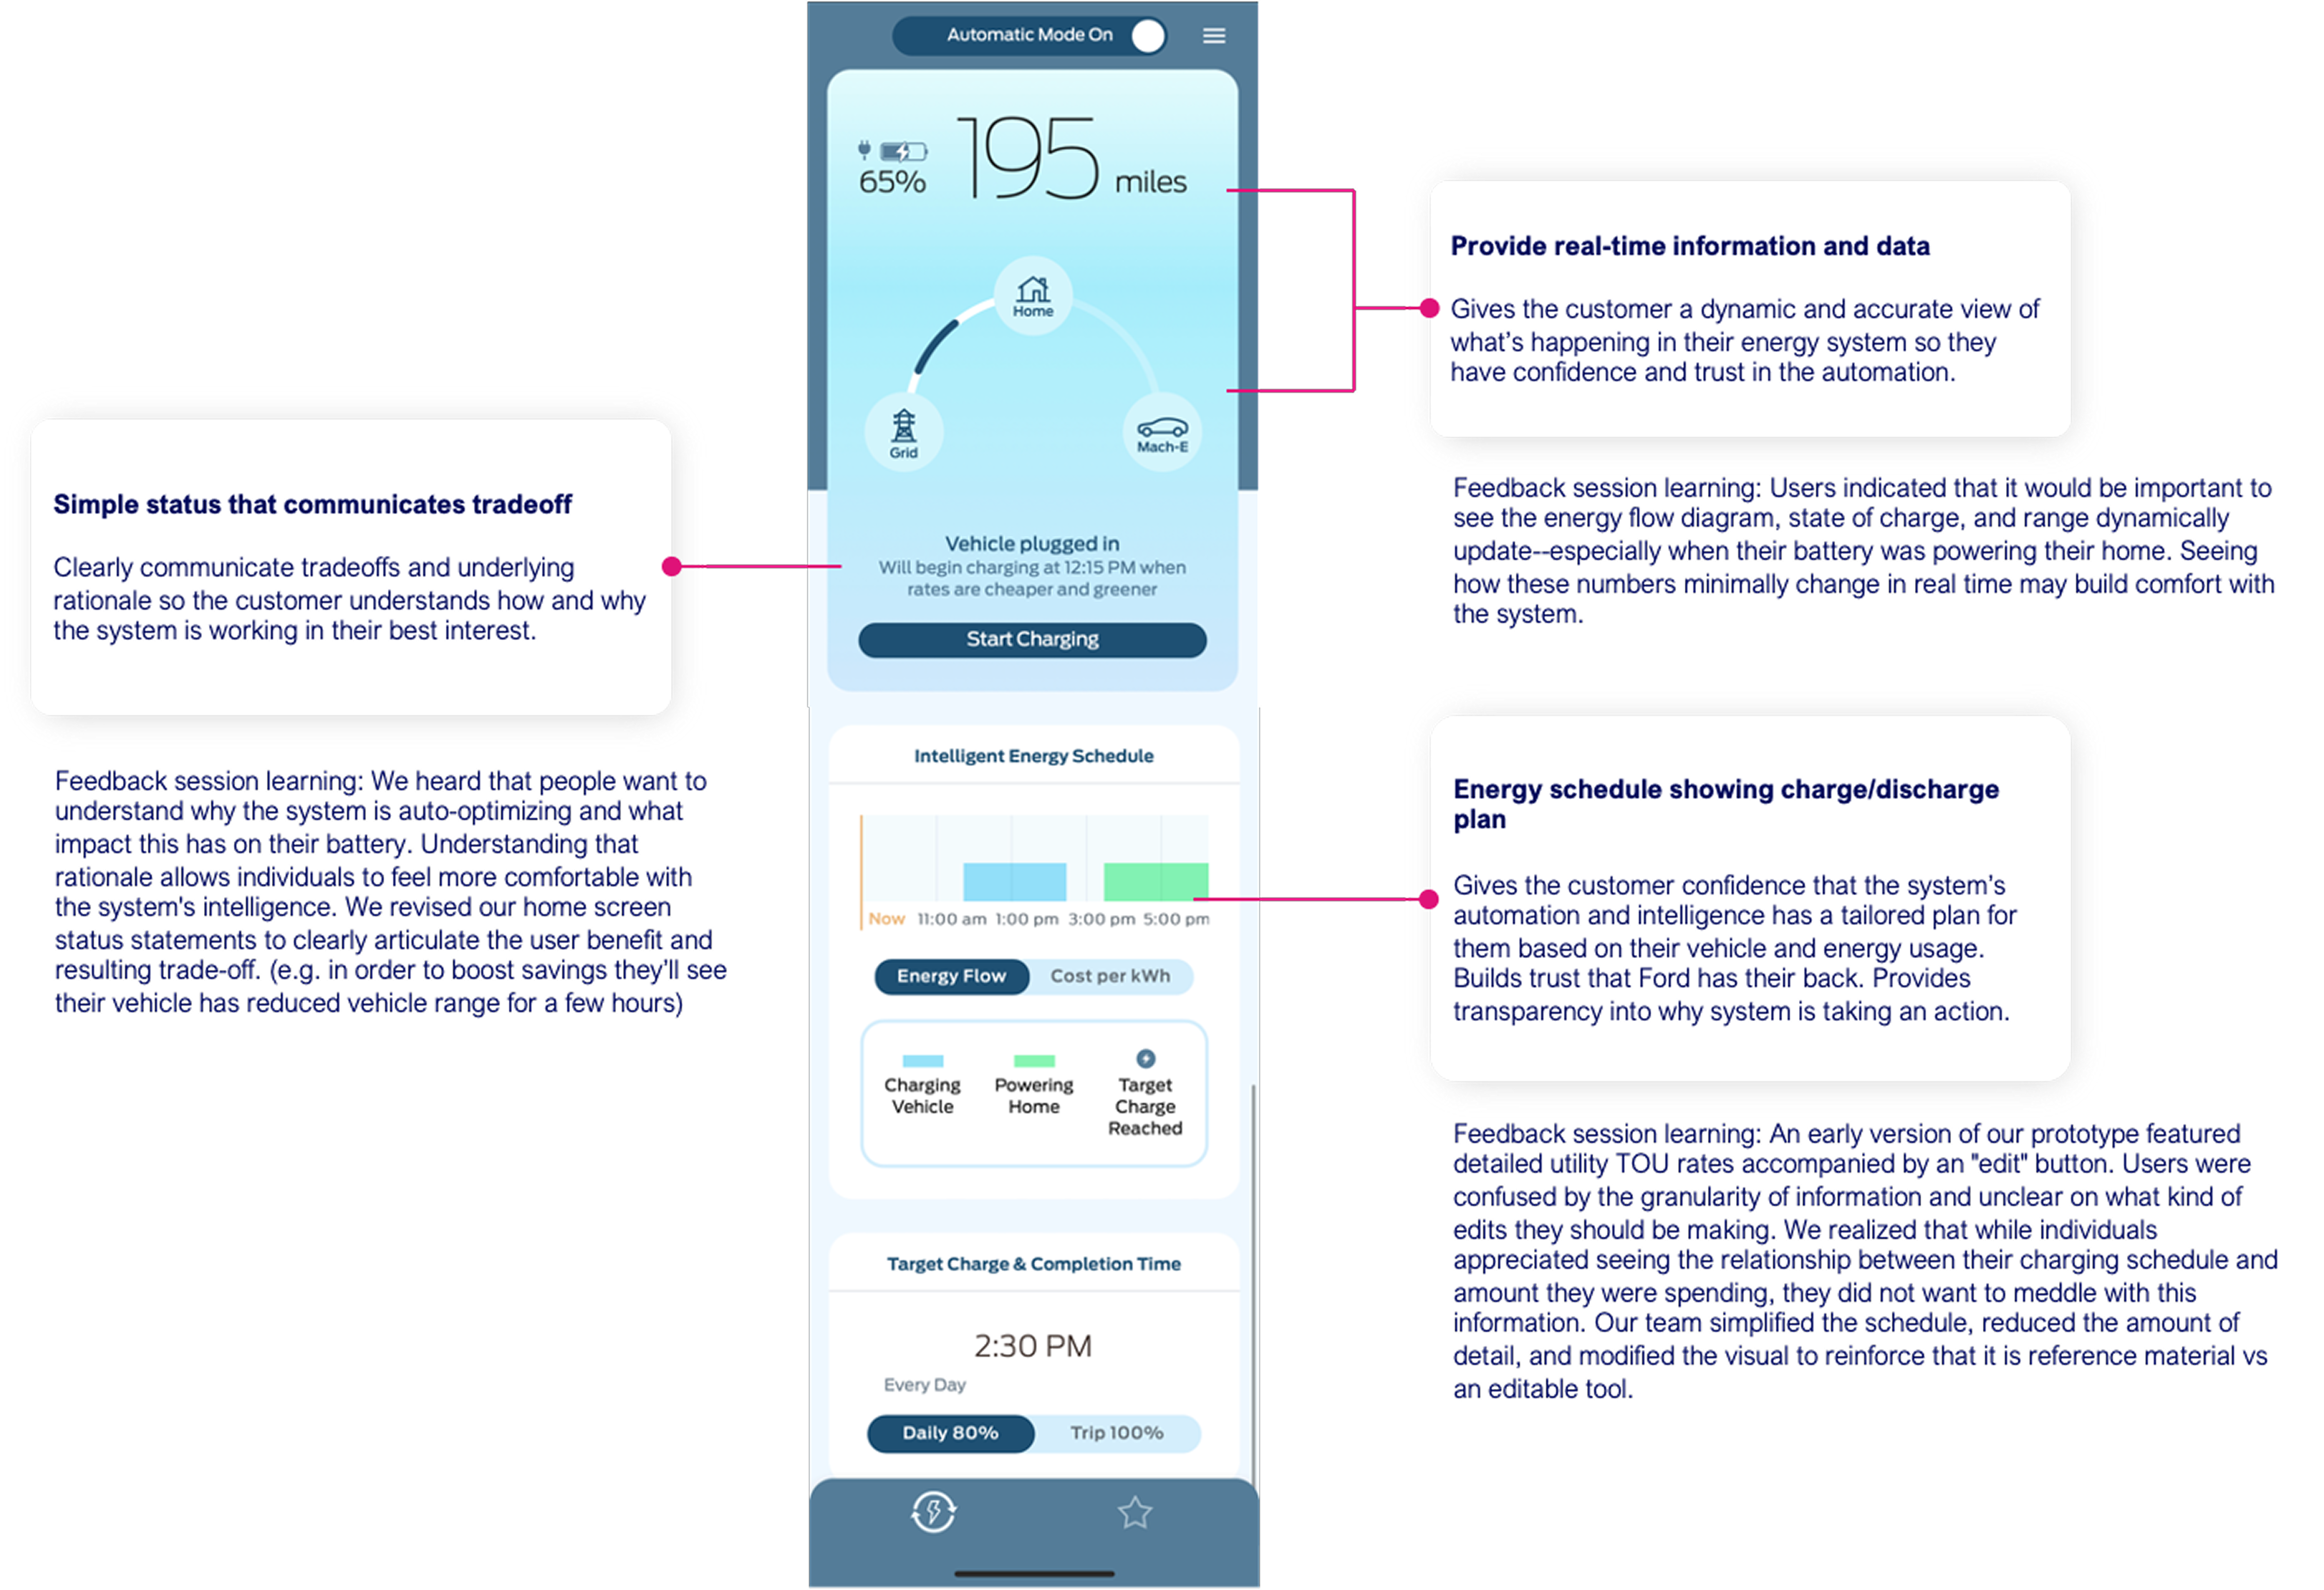
Real-time energy flow visualization, future schedule transparency, and always-accessible manual override.
Seamlessness
Set-and-forget automation. "Parent proof" simplicity with no tech expertise needed and no daily input required.
Savings
Lead with feel-good financial insights. Shareable results for EV pride. Environmental benefit as a welcome bonus.
MVP1 mobile app
Plugged In
Charge Through
07 The Experience
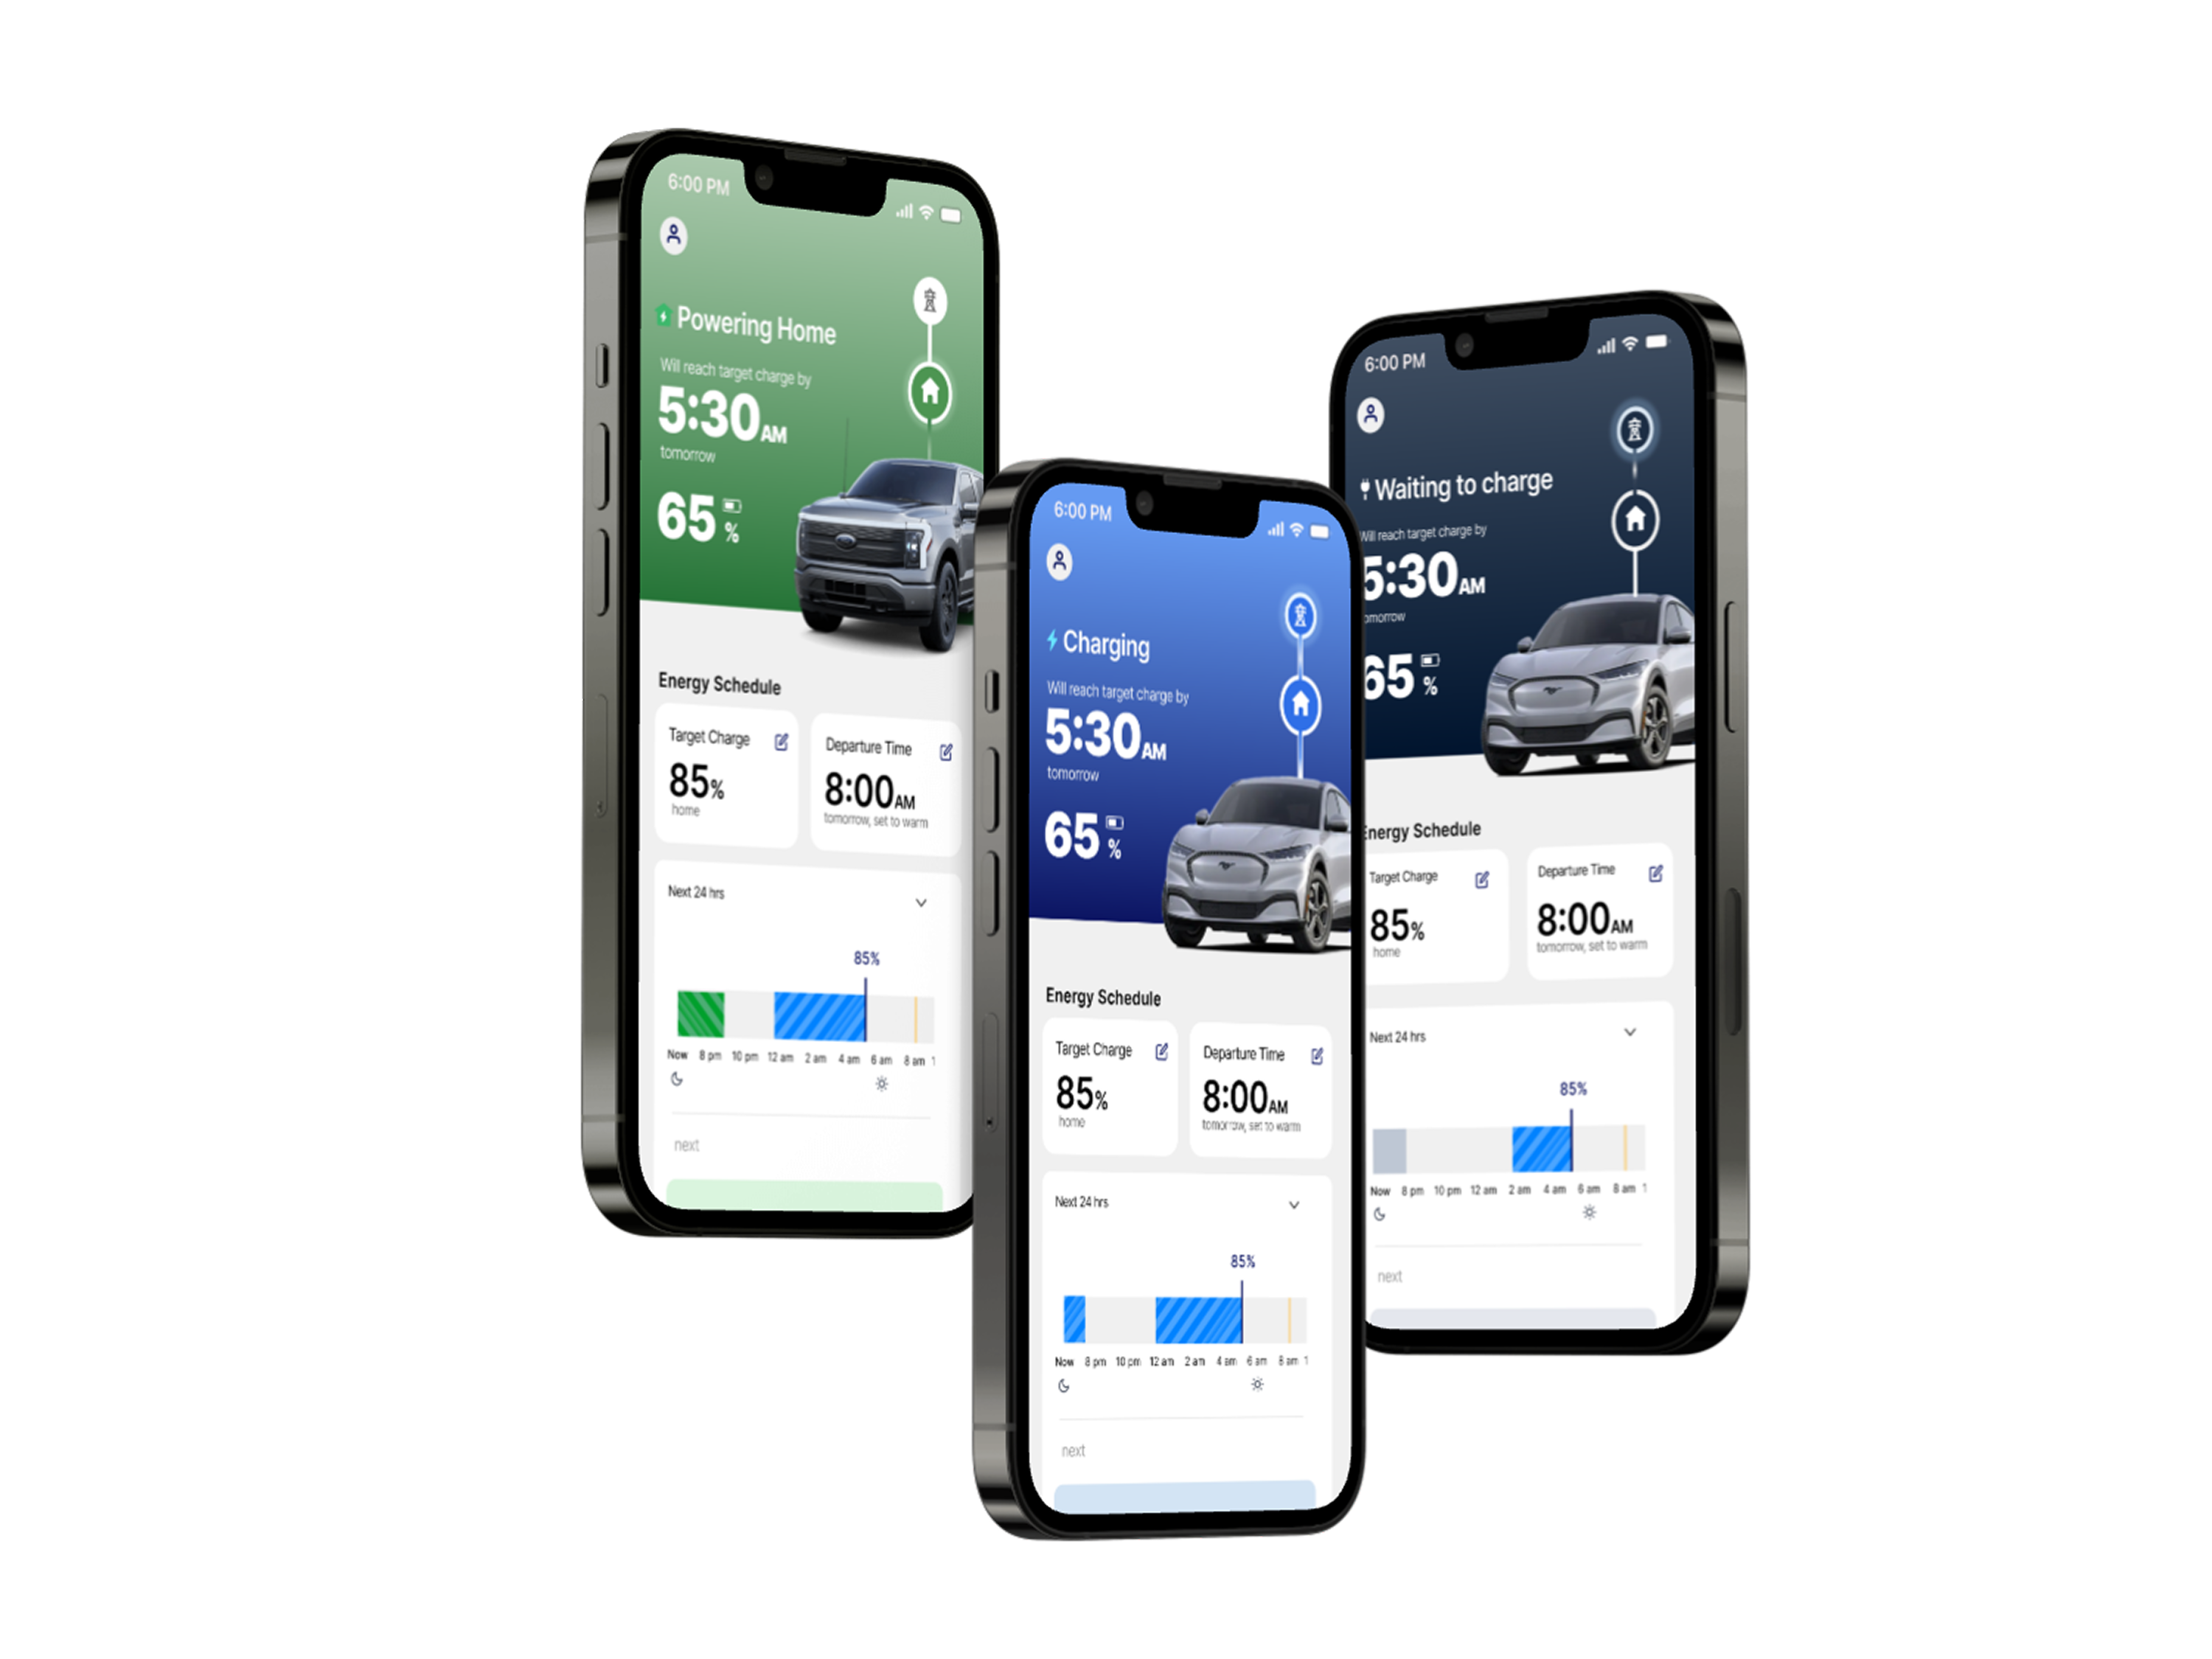
Color as a universal language
The energy flow visualization uses real-time color coding for instant comprehension. One glance tells you everything. No reading required.
Powering Home
Green state: vehicle battery is actively powering the home. The system is working for you right now.
Charging
Blue state: vehicle is charging from the grid on an optimized schedule, minimizing cost.
Waiting to Power
Neutral state: vehicle is plugged in and standing by. System is ready, no action needed.
Powering Home
Charging
Waiting to Power
"Tesla doesn't tell you what it's going to do in the future." (research participant)
Showing the upcoming charging schedule, not just the current state, became a key differentiator. Users valued knowing what the system planned to do, not just what it was doing now.
Manual controls were always present as a security blanket. Almost no one used them, but knowing they existed made automation feel safe to trust.
"If FordPass looked like this when I launched it... it's almost perfect." (research participant)
08 Launch
Ford Energy Rewards goes live
EnergyKit established the design and research foundation. The product shipped as Ford Energy Rewards, a free program that automatically manages EV charging to earn incentives while supporting grid stability.
Smart Charging
Ford manages home charging schedules automatically, shifting consumption to off-peak hours and renewable-rich windows.
Utility Partnerships
Launched with TXU Energy, Southern California Edison, and expanding nationally. Each utility tailors incentives to local grid needs.
Real Incentives
Mach-E owners earn ~$800/year. F-150 Lightning owners earn ~$1,200/year. Escape EV owners earn ~$300/year.
User Control
Enrollment via zip code. Confirmation within 10 business days. Override anytime. Unenroll anytime. Zero lock-in.
09 Impact
From experiment to national infrastructure
Shipped nationally
Ford Energy Rewards live with multiple utility partners across the U.S., continuing to expand.
$300–$1,200/year per owner
Verified annual savings across Mach-E, F-150 Lightning, and Escape EV models.
Trust validated at scale
Only 5 automation opt-outs across 2 weeks of live pilot with 14 active participants, showing high comfort with full automation.
Design system established
Six principles and three UX pillars now guide Ford's full energy services roadmap and future product decisions.
Platform foundation
Built to expand: solar integration, V2H, V2G, home energy management. The ecosystem is ready to grow.
Ford now has a direct relationship with utilities, helping customers earn money while stabilizing the grid. All without lifting a finger.