01 Overview
Cabin Controls
Climate & Media
Distraction-Free Cabin Controls: A novel physical-digital interaction paradigm.
My Role
Led the end-to-end design prototyping by integrating digital interaction, visual design, and physical controls for best possible experience.
Outcome
Created a new hybrid interaction model for next-generation vehicle platform.
45 days to drivable prototype, compressed development timelines by over 70%.
6 months iterative refinement for production-ready design.
Participated in 3 rounds of research studies with real customers over 3 weeks.
Impact
De-risked critical leadership decision to avoid hardware rollback.
Set a new rapid prototyping Benchmark.
Established scalable interaction and haptic patterns.
-
V1 Design
Prior team
-
Usability Study
San AntonioFindings → new direction
- 45 days
Redesign →
PrototypeI joined here onwards
-
User Testing
Palo Alto -
Design
Iteration II -
User Testing
Sacramento -
Iteration III
-
User Testing
San Jose -
Handover
02 Background
Why this project existed
Physical climate controls are cluttered and pull drivers' eyes down, even on trucks built around big, tactile buttons. Fan speed alone accounts for more climate interactions than every other climate action combined, and most of that happens while the truck is moving.
75%
of climate adjustments happen while the truck is in motion
48%
of the time, a driver's gaze is off the road completing a climate task on a physical system, the highest of any secondary task measured
68%
of crashes and near-misses involve a driver mid secondary task, including climate, radio, or navigation
3–4
objects the average driver can hold in spatial memory; anything beyond that has to be re-located, not recalled
At 65 mph, a 4-second glance down covers the length of a football field, and studies show a glance over 2 seconds is enough to double the chance of a crash or near-miss.
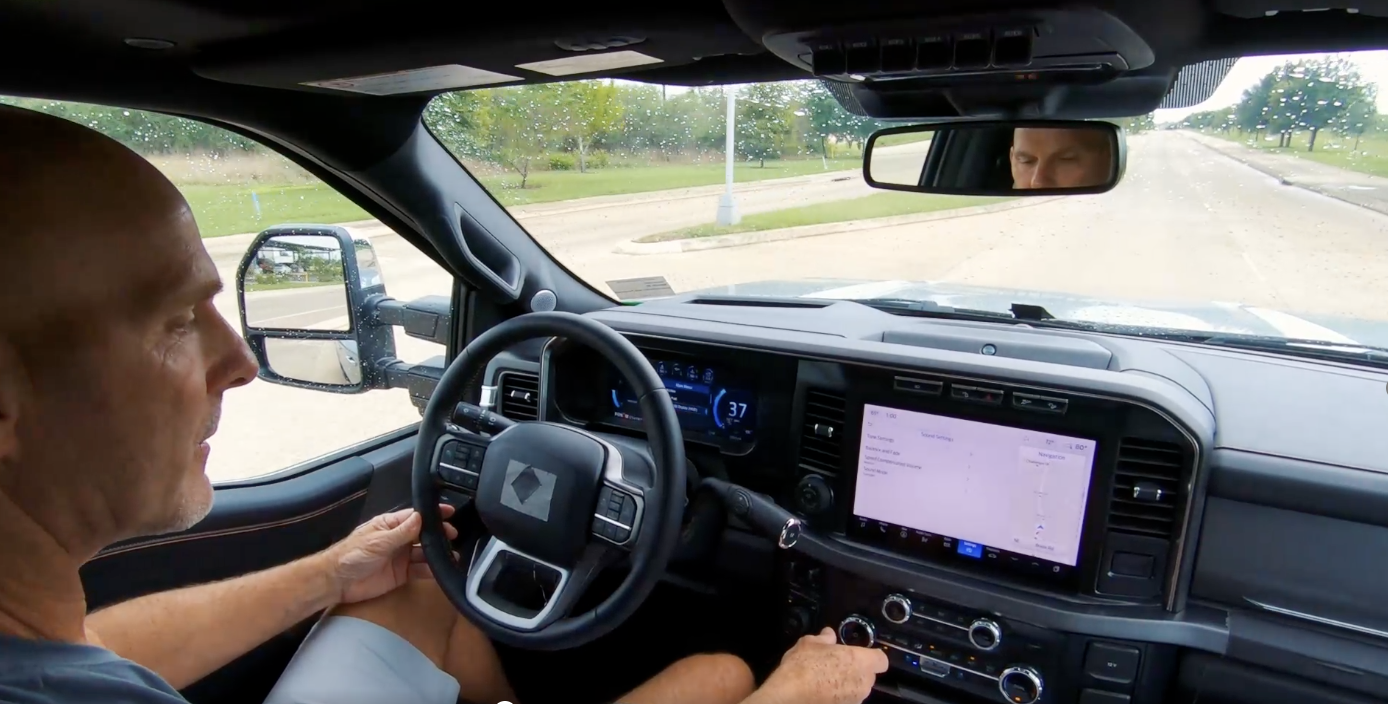
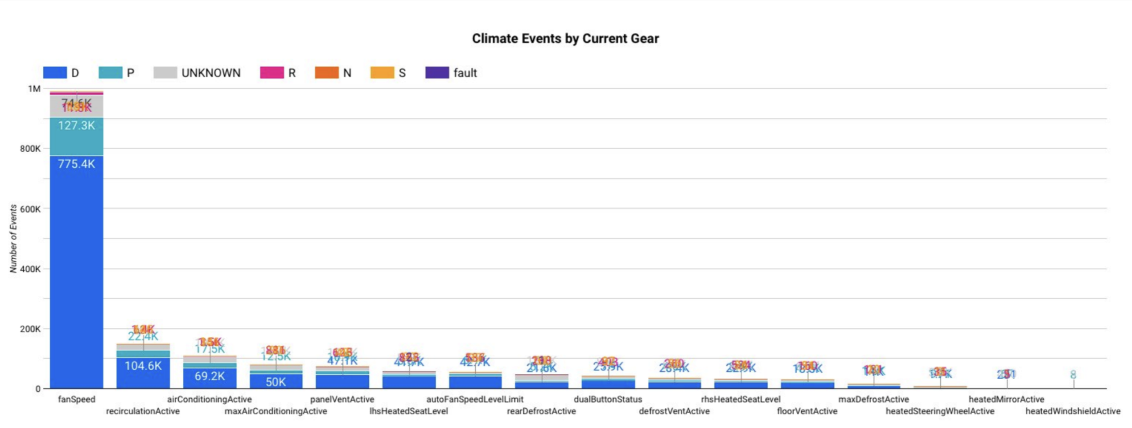
The data doesn't support an either/or choice between physical and digital. The real goal was making controls as fast and glanceable as possible while keeping drivers' eyes up and out, not eliminating physical inputs outright.
03 Challenges
Constraints & complexity
Safety Risk
The shift from physical to digital-only controls forces "eyes off the road" for a high-frequency task.
Tactility
Users look for blind actuation and "muscle memory" for climate experiences.
User Friction
Removing physical controls lowers perceived vehicle quality, but going all-digital isn't a fix either. Prior fully-physical designs ranked poorly on clutter scorecards, while fully-digital systems like the Lincoln Nautilus, Tesla, and Rivian score worse in usability studies and carry higher problem rates than their segment.
04 Physical Interactions
New physical hardware capability
The controller provides tactile interaction with the vehicle infotainment system through rotational, directional, and press-based inputs. The controller enables safe driver operation with minimal visual distraction.
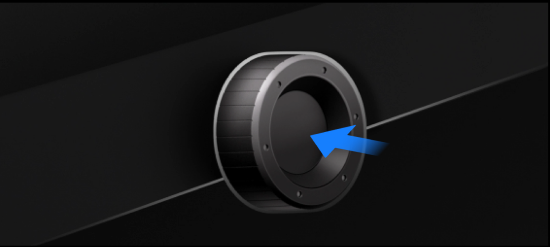
Press
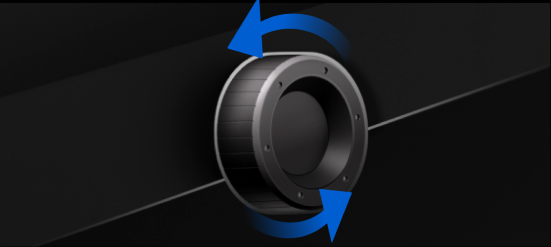
Rotate
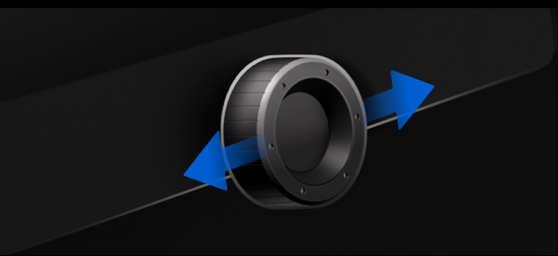
Toggle
A physical knob handles broad, gross adjustments, while a mix of hard and soft buttons covers prioritized use cases, leveraging good design and ergonomics to make controls efficient without going all-digital or all-physical.
Strengths
- Keeps eyes up and out: built for glanceable, largely blind operation
- Less visually cluttered than a full physical button + knob layout
- Knob handles broad adjustments; hard/soft buttons cover prioritized use cases
Trade-offs
- Unfamiliar, novel: has to be learned, unlike conventional stalks or buttons
- Discovery isn't automatic: the jog/toggle interaction needs onboarding on first use
- Lower-priority functions sit one extra step away, inside a climate drawer
05 User Pain Points
What users struggled with
This new hardware capability was first put into a design by the previous team, who spent an initial 6 months (Jan–Jul 2024) building the very first version. I took part in the week-long usability study in San Antonio that put that first design in front of real customers, and it was through this research that I discovered it had fallen short across several usability testing metrics. I joined the team afterward to lead the redesign and prototyping that addressed these findings.
Quality
- Hard to tap accurately without looking or while driving
- Lost track of active state, increases eyes-off-road duration
- Too many first-surface functions
Discoverability
- Round dial doesn't imply jog interaction
- Jog was not discovered without explanation
- Jog added steps for quick actions
Balance
- Truck customers prefer utility-focused, simple, easy-to-use controls
06 Stakeholders
Who I worked with
Design & Experience
- Visual Design
- Design system alignment
- Hardware Design
- Unified digital & physical design
Build & Integration
- Hardware Engineering
- Haptics & vehicle setup
- Fabrication
- Validated 3D-printed housing
- Software Engineering
- Flow & logic handoff
Validation & Decision-Making
- Research Team
- Setup & observation
- Leadership
- Design critiques & alignment
07 Project Outcome
Design outcome summary
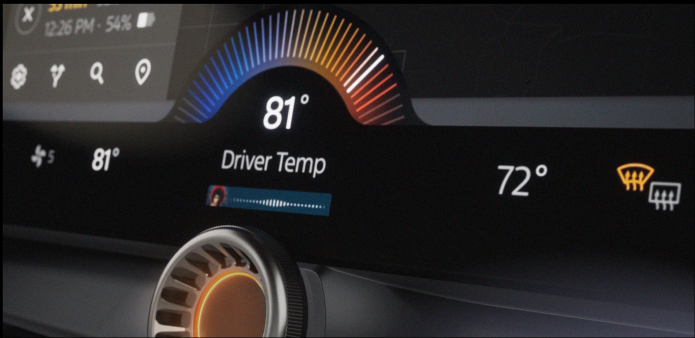
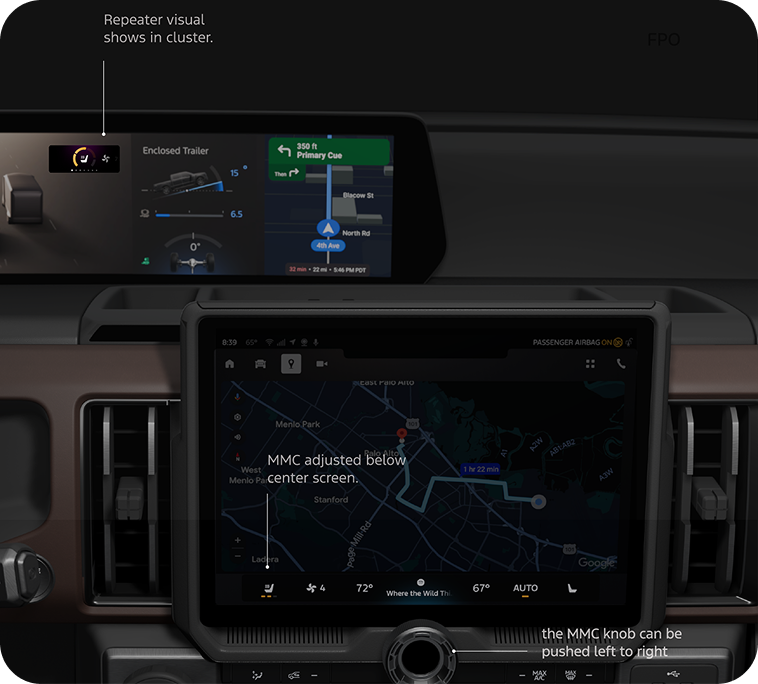
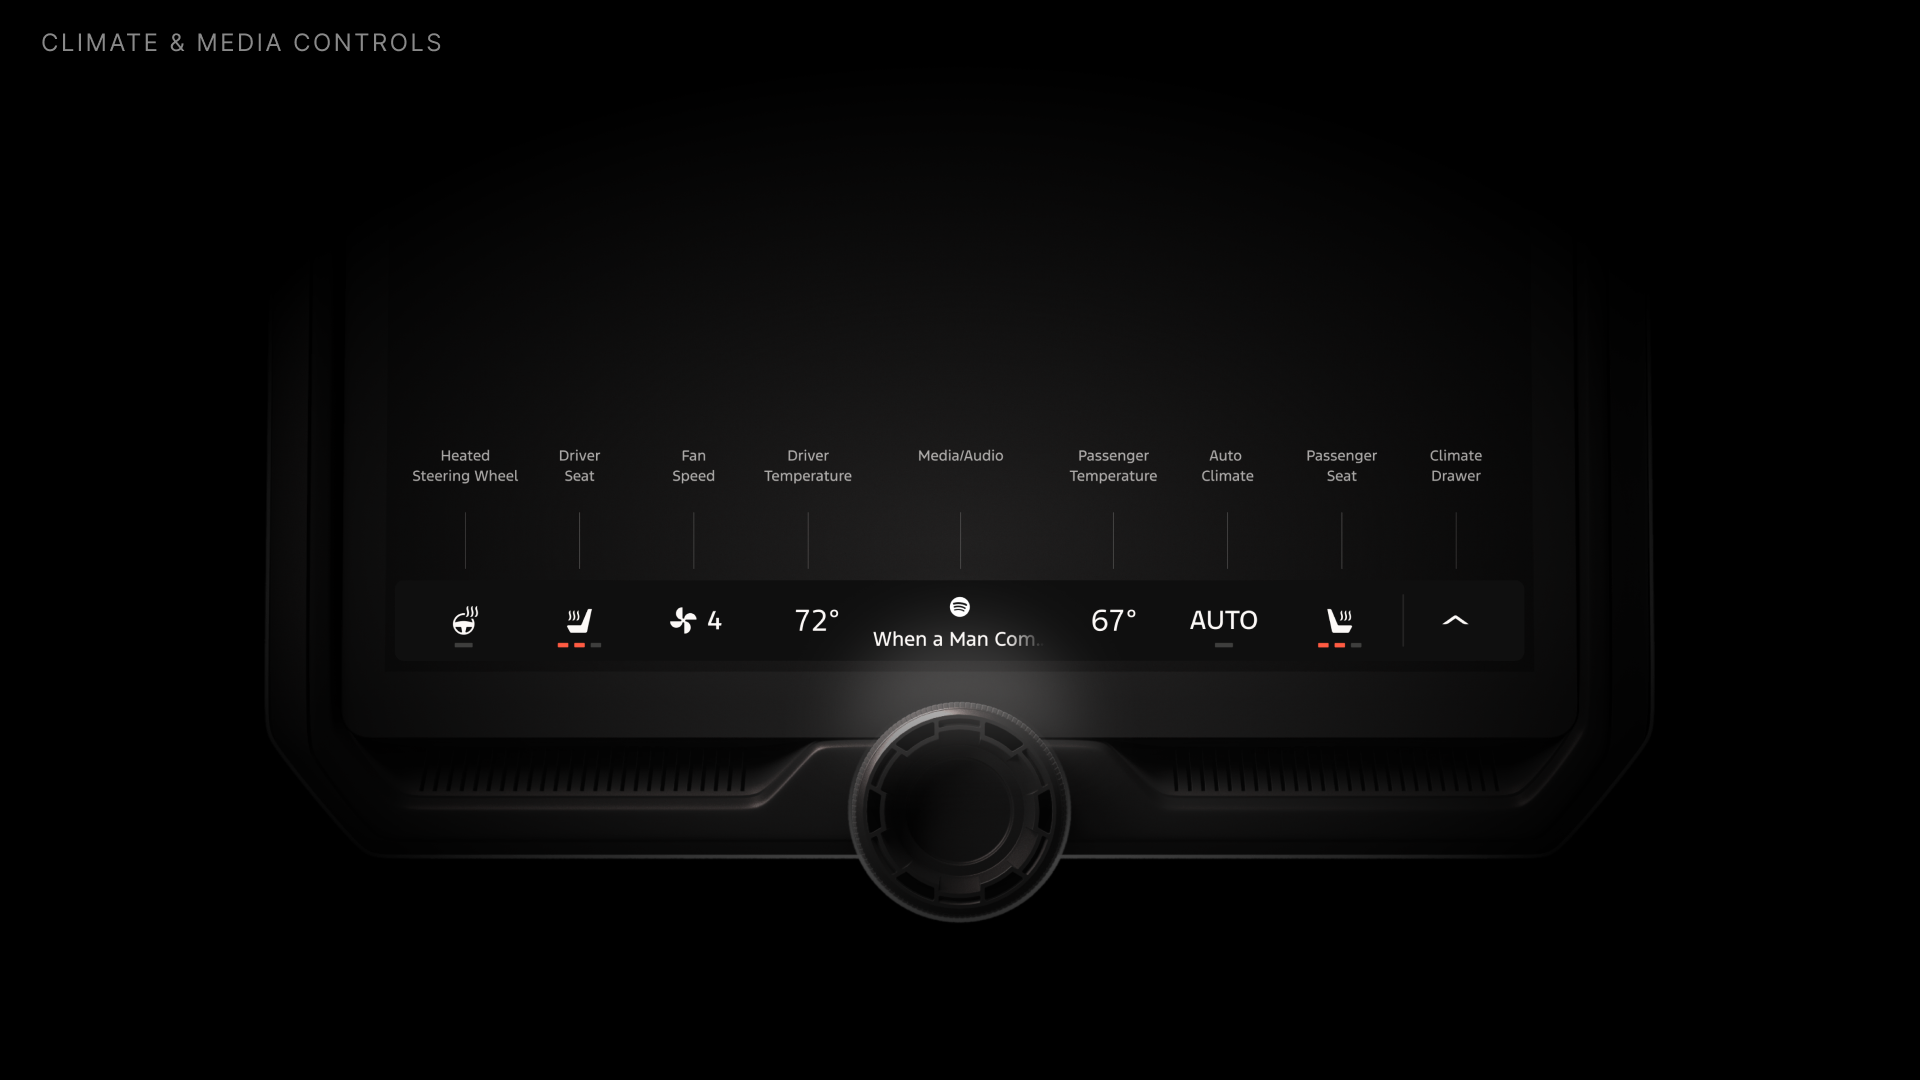
The final design introduces a hybrid physical-digital interaction system, a climate bar anchored to the bottom of the screen with a repeater component showing in cluster display that both controlled by the physical dial hardware.
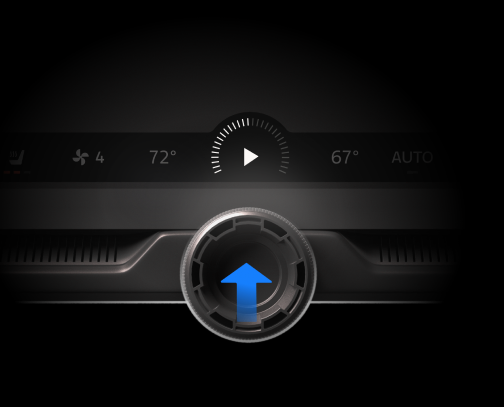
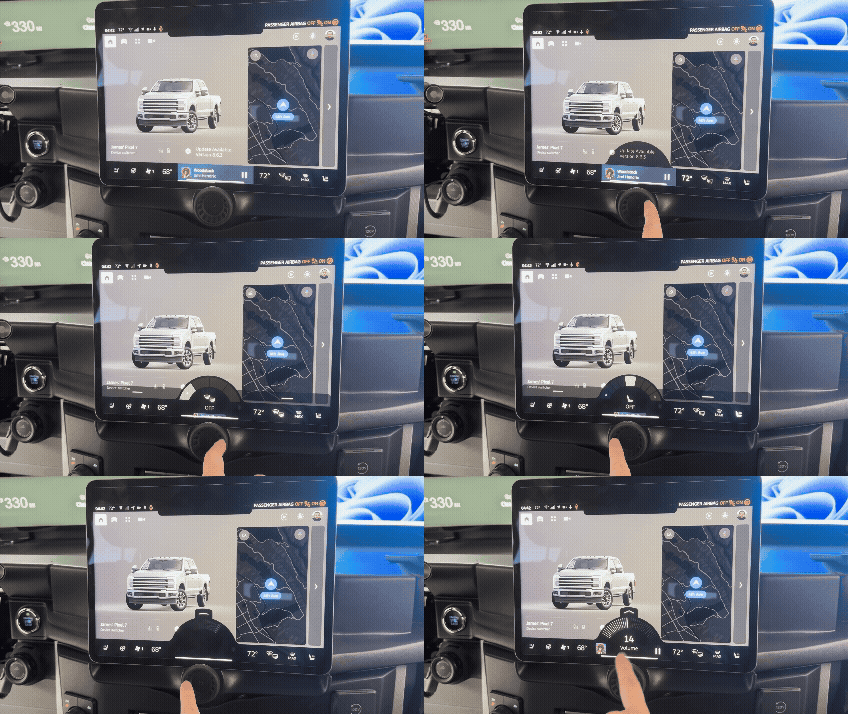
Press to Play/Pause Audio
ex: Audio
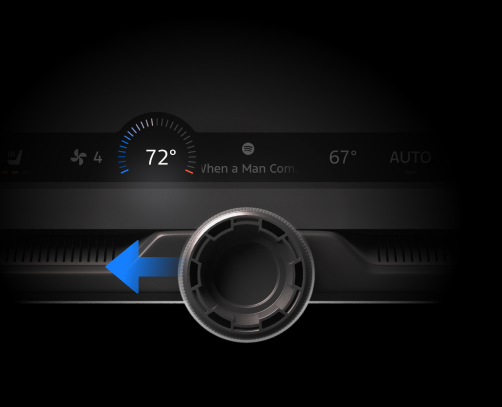
Toggle to navigate through functions
ex: Driver Temperature
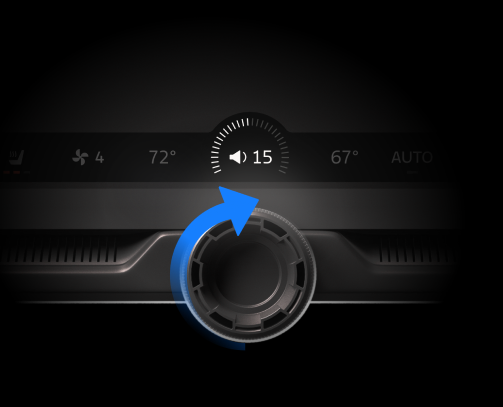
Rotate to adjust values
ex: Volume
08 Design Workflows
How I built it
Figma
- Define the UX flow and logic
- Break down components into animation layers
- Export layers into Protopie
Protopie
- Create reusable components
- Build states and logic
- Integrates with real data
- A/B testing
Hardware Integration
- Setup design in vehicle cluster display
- Test design with physical controls
- Adjust position, visuals & interactions
09 High Level Flow
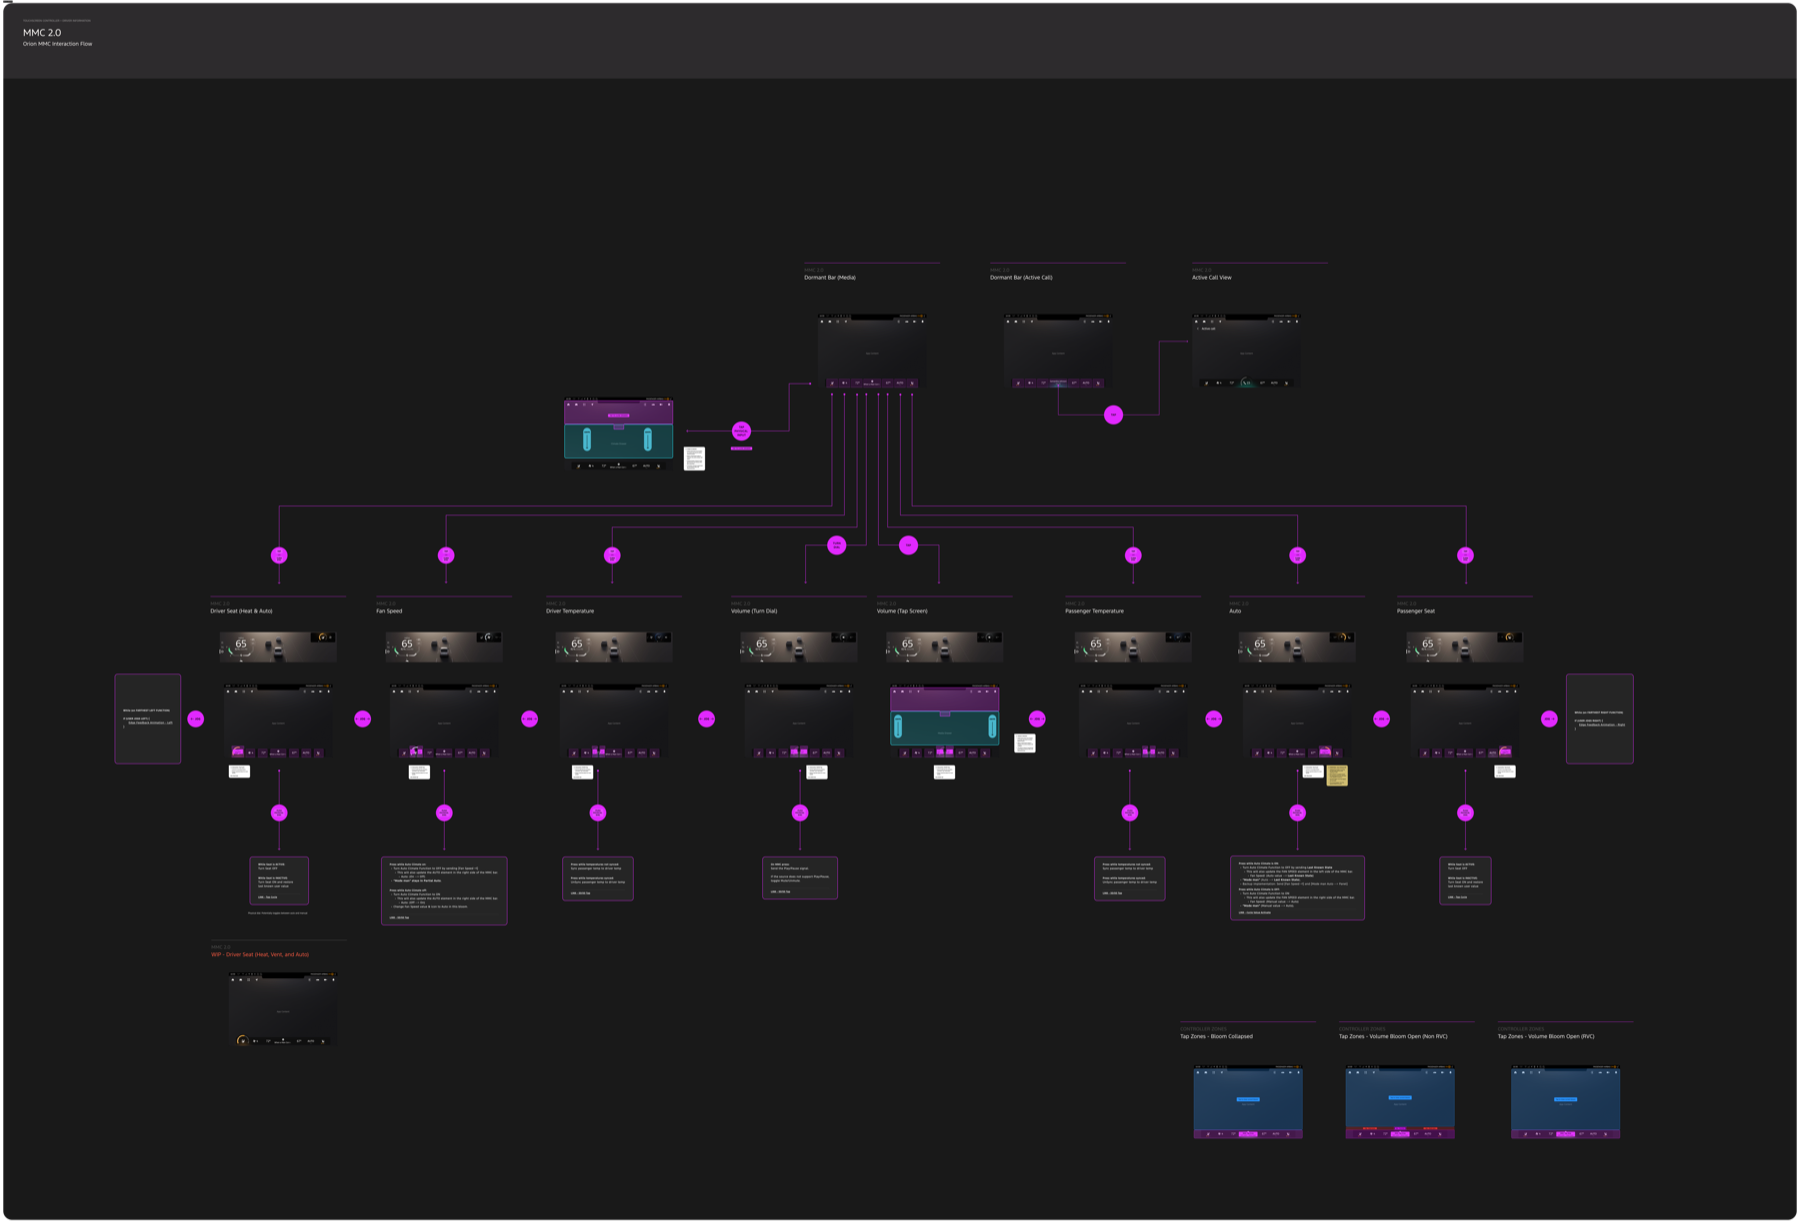
Interaction architecture
Full interaction map covering all states, transitions, and edge cases across the climate and media control surfaces.
10 Prototype I
First functional build
I built a fully interactive prototype with complete logic flow and real data integration, from Figma through Protopie. iPhone and iPad served as the testing devices, mounted directly in the vehicle to validate the experience in context.
Repeater
- Mirror climate controls in the cluster to support eyes-on-road interaction
Haptics
- Haptic strength and resistance signal end limits
- Haptic steps align with visual feedback
11 Prototype I · A/B Testing
Repeater position & pagination
This is an example of how I tested different visual directions live in a single view, letting leadership and the team compare dynamic interactions side by side and make decisions with greater confidence and speed.
A/B Variants
- Repeater design compared across multiple versions
- Pagination layout tested for quick-access hierarchy
Metrics Measured
- Time to locate the active function
- User orientation and awareness within the system
12 Prototype I · Research
What we learned
I took part in a week-long research study in Palo Alto with our research team, marking our first on-road testing of the design with real users. I helped the team set up the prototype for testing and guided them on the key testing plan. The repeater tested here was already an improvement over earlier versions evaluated in San Antonio and Dearborn.
Research Goals
- Can participants quickly learn how to use the most recent design?
- Can participants blindly make climate adjustments while driving?
- Does the repeater reduce glances to the screen or hand?
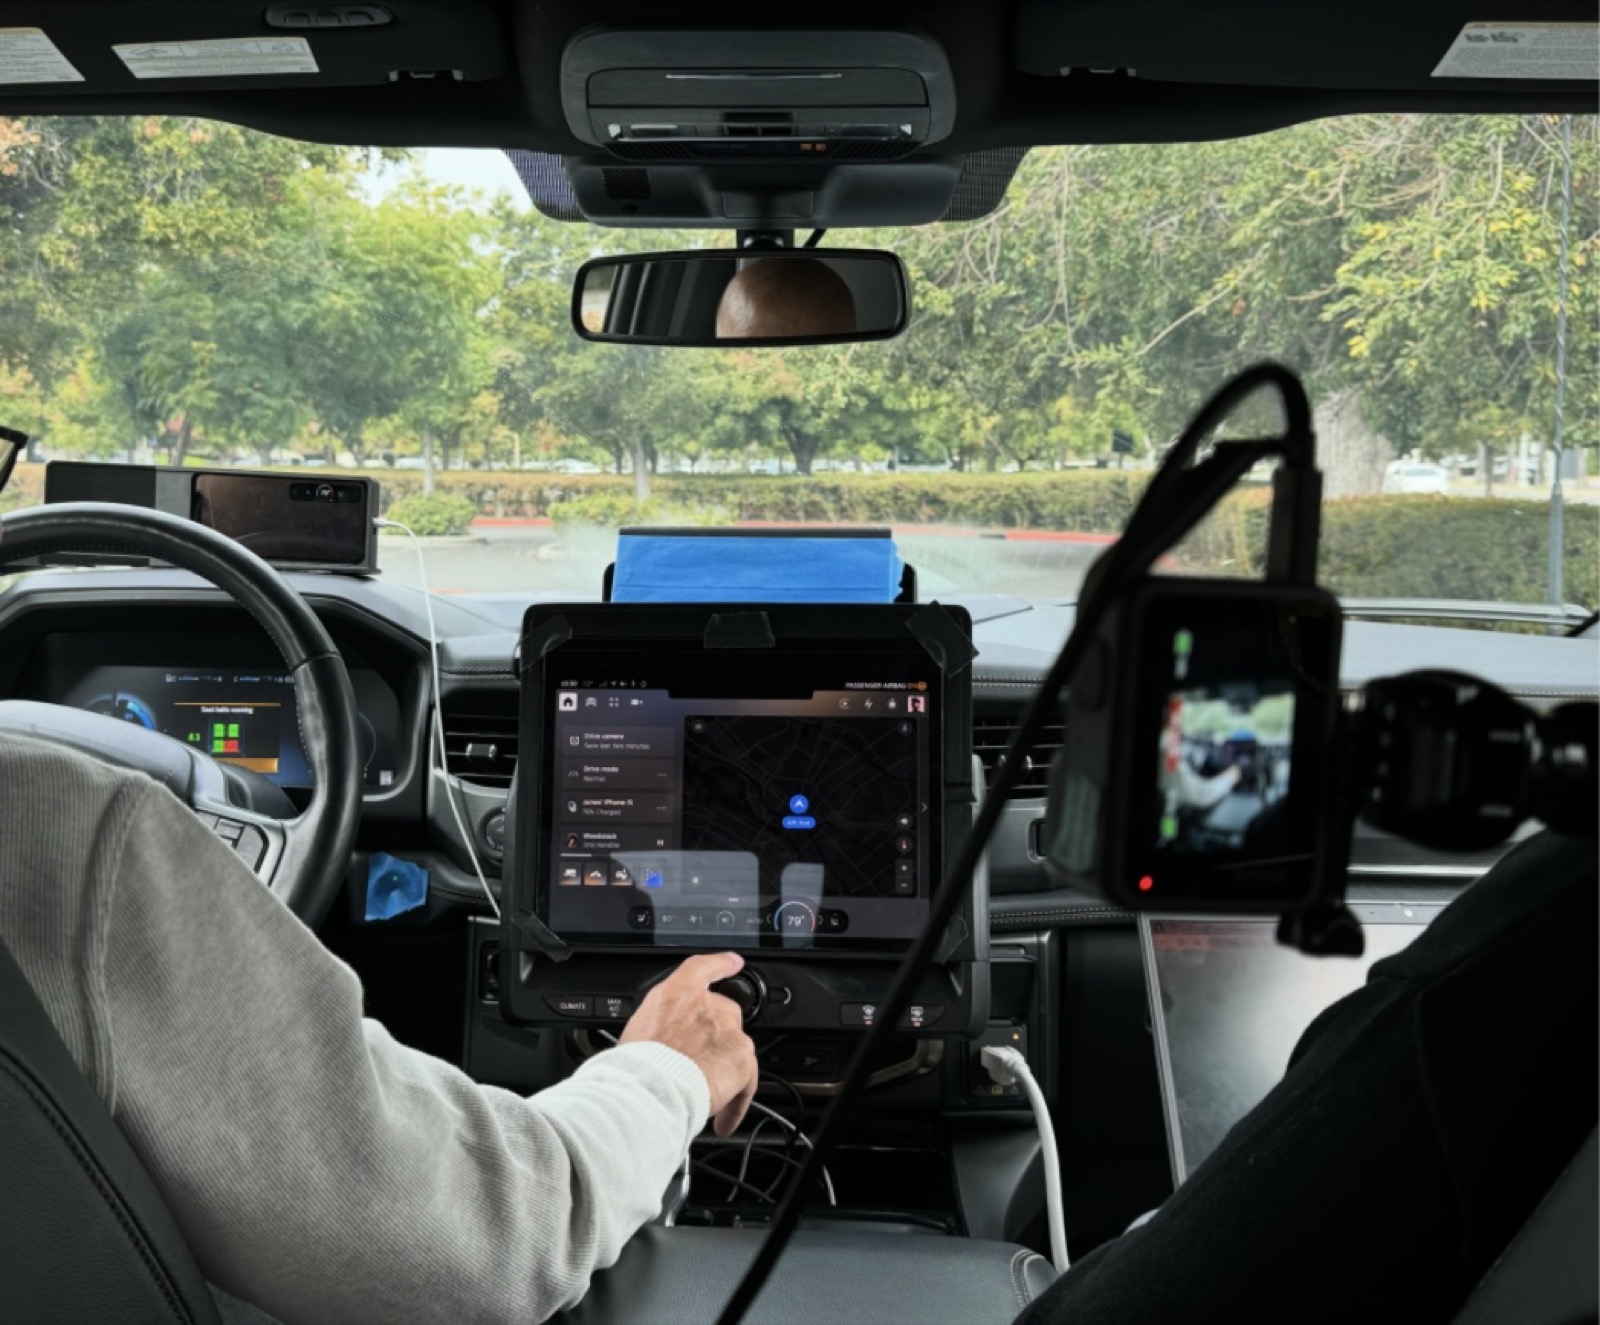
"This is easier than using my physical buttons." 65-year-old male, Audi A7 driver
✅ Repeater keeps attention on the road
- Most users adopted the new interaction model after one drive
- Dots along the repeater help with positioning: once the order is learned, users stop needing to look at the screen to gauge how far left or right they can go
- Users still preferred touch option when parked
✅ Physical + Digital received strong positive feedback
- Nearly every respondent rated it as easy to use as their current climate system after a bit of practice
- No measured loss of efficiency adjusting temp, fan speed, heated seats, or rear defrost while driving
- Users felt safer
⚠️ Discoverability
- Only 1 respondent discovered the toggle unaided, despite on-screen directional brackets
- Most needed the jog function demonstrated once, then adopted it immediately and stopped tapping icons
⚠️ Visual & physical affordances mismatch
- Touch targets are too small
- Arc progress bar encouraged drag interaction: more than 80% of respondents tried to drag or tap the expanded "bloom" area, which wasn't functional in this iteration
- Directional brackets weren't read as left/right indicators for the toggle
- Short timeout caused unintended actuations
- Excessive icon shifting
- Rotary should protrude more for accessibility: hard to grip with long nails or gloves
🧠 Haptic strength affects blind operation
- Heavier haptics helped: louder, more distinct "bumps" let some respondents count position left/right without looking, as a backup to the repeater
- Lighter haptics caused overshooting, and respondents asked for added audio feedback to compensate
✅ Prototype I, overall
- Repeater diminished glance-down time, keeping eyes up and out
- Easy to learn and use overall
- Task completion rates on par with the current production climate system
- One centralized control enabled multi-tasking, earning high marks for "excitement" and "inventiveness"
13 Prototype II · Research
Iteration results
Building on the first round of findings, I led a second iteration that introduced tooltips, resolved the issues surfaced earlier, reduced icon shifting, enlarged interaction zones, and extended timeout durations. I then joined the research team for a week-long study in Sacramento, taking part in on-road interviews and observing real customers interact with the design firsthand to surface further learnings.
✅ Tooltips improved discoverability
- Reduced verbal instruction needed in most cases
✅ Longer timeout reduced errors
- Additional timeout time prevents unintended actuations
⚠️ Visibility issue
- Bigger visuals and higher contrast needed for daylight, glare, and low-light
🧠 Hybrid interaction expected
- Users continue to expect touch input for quick access
- Hardware remains preferred while driving
14 Prototype III
Visual refinement & media integration
After the second round of iterations, I partnered with the visual design team to finalize and polish the design system down to each individual component, resulting in this final build. Reaching this production-handover-ready stage took another six months of refinement.
🎨 Visual & Interaction
- Incorporated visual changes to align with design systems
- Increased target zones and space between functions
- Minimized icon shifting
- Increased contrast and color spread
- Reordered the functions
- Improved logic for sync states
- Added woodpecker interaction: split each function's expanded bloom into two tap zones, left to decrease and right to increase
🎵 Media Drawer Integration
- Built media drawer UX flow for switching source
- Integrated media control with drawer flow
- Added real music & sound to test source switching and edge cases
🤝 User Research & Handover
- Final round of user testing with production-ready prototype
- Design handover to engineering team
💡 My Proposal: Drag Interaction
During research sessions I observed that 8 out of 10 users instinctively tried to drag across the arc control rather than tap it, the curved shape itself was suggesting the gesture. I proposed adding a native drag interaction to the research and design teams, but the idea got rejected initially. To make the case, I built the interaction for demo: team was convinced after experiencing the smooth, responsive interaction, and drag became a core part of the final design.
My design: wide drag zone across the control adjusts the targeted function, giving drivers a wide margin for error on a moving, bumpy road instead of requiring them to hold a small, precise target.
Reference: iPhone Control Center, the interaction model I mimicked. Touching a control like brightness or volume lets a finger travel across the entire screen to adjust it until release
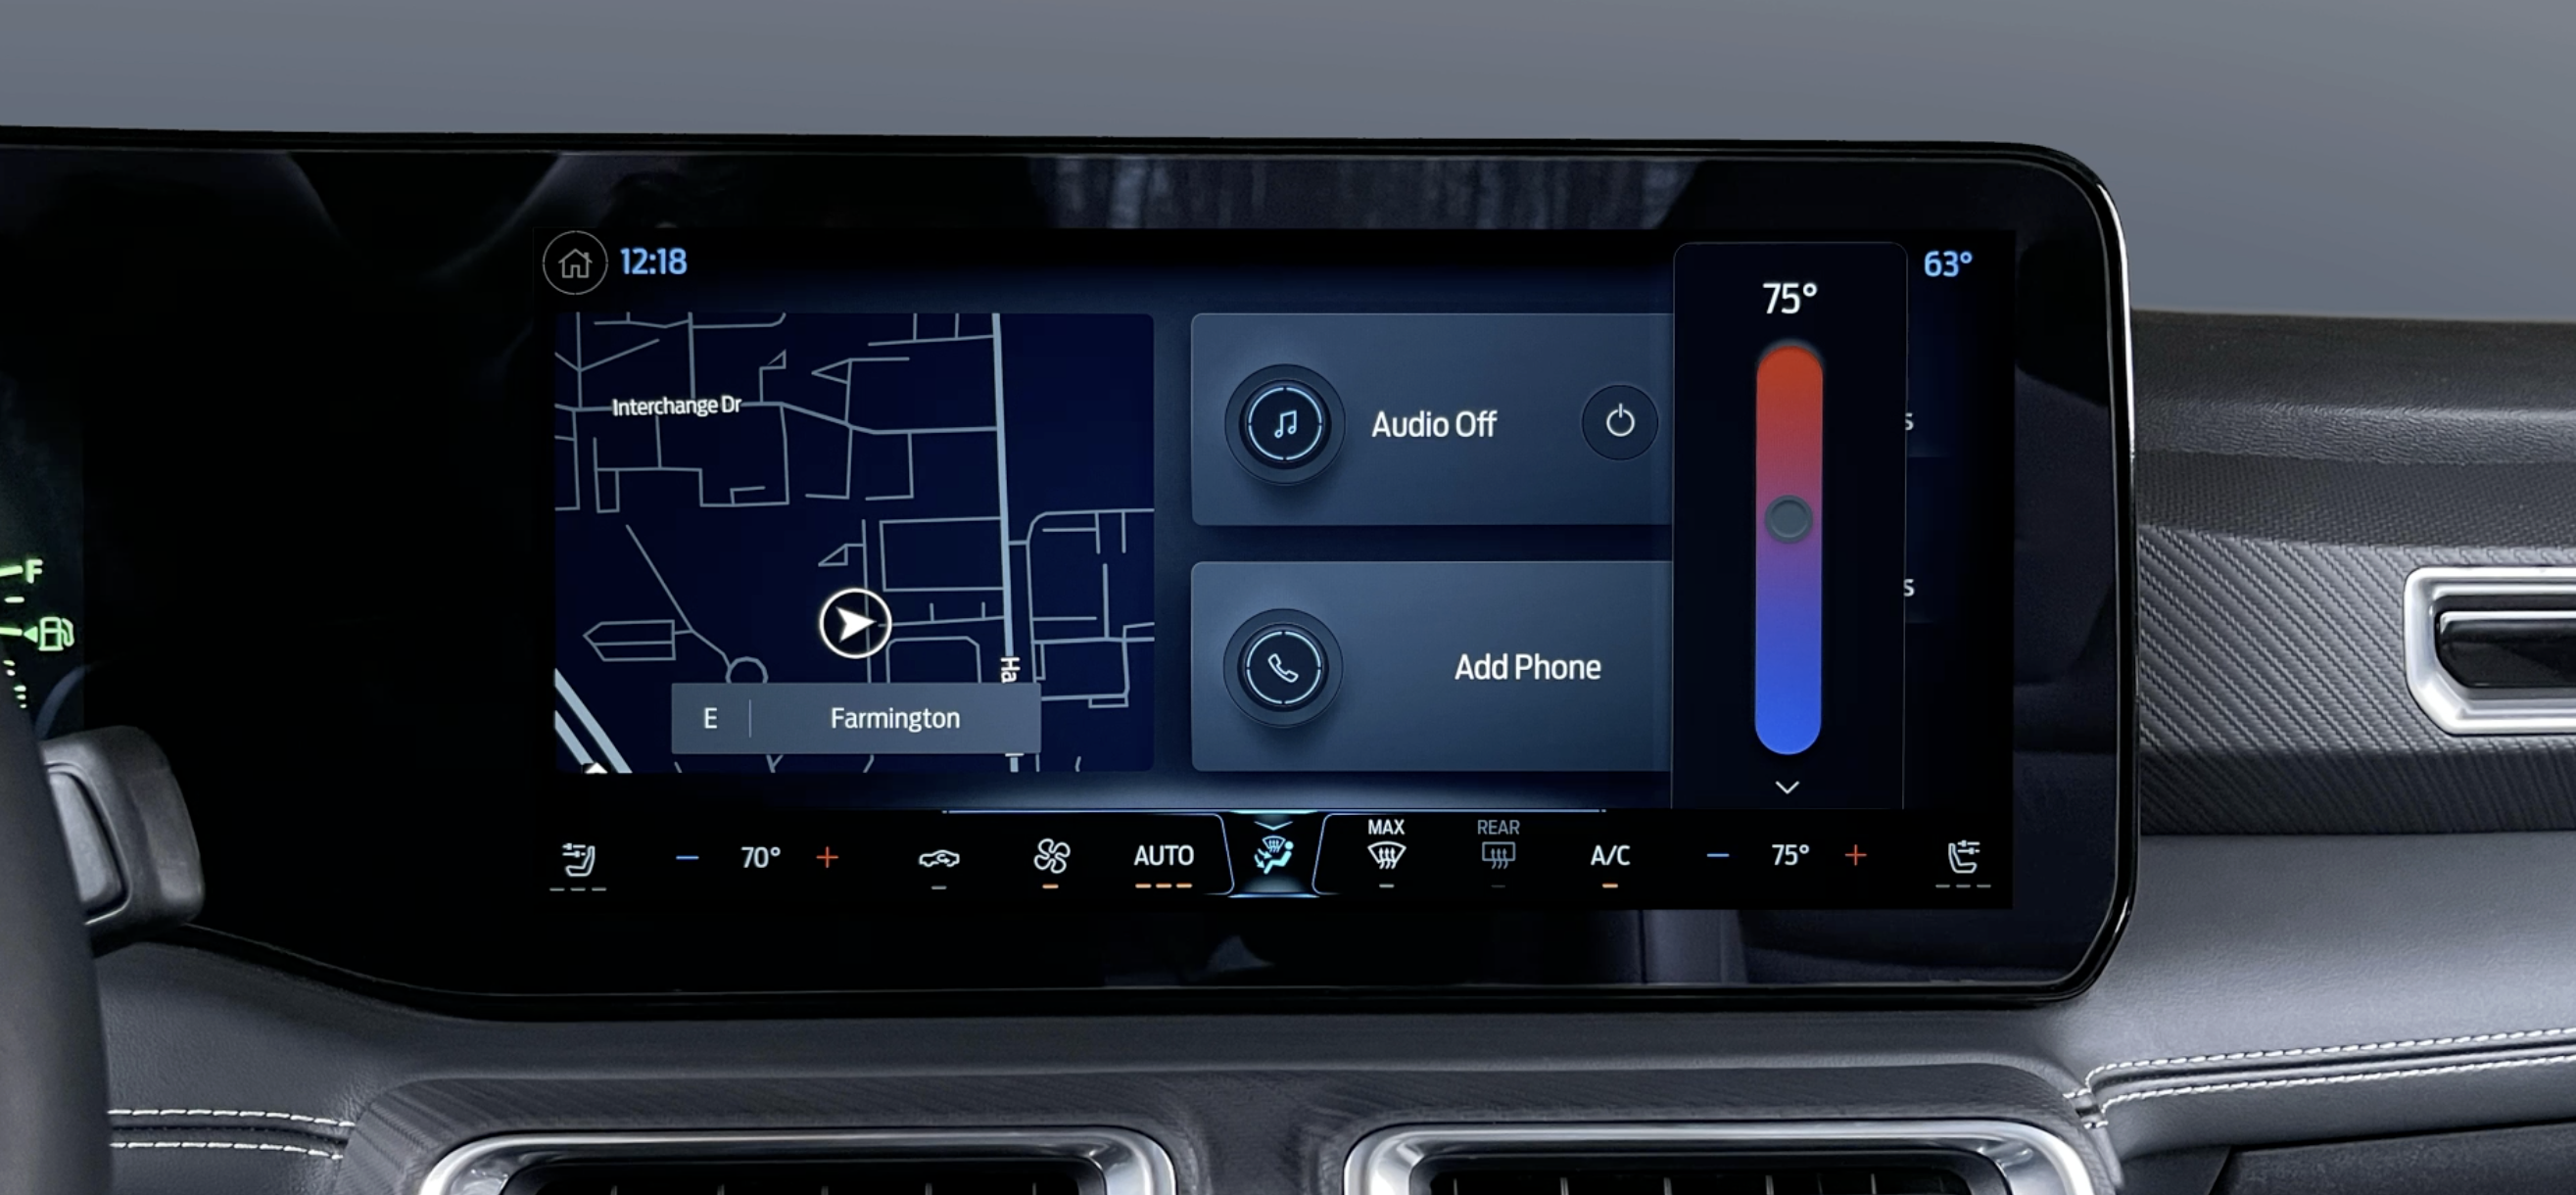
Example of production climate with limited drag zone
Final in-vehicle demo of the touchscreen, showing both the woodpecker and drag interactions in the finished experience.
15 Results
The hybrid approach held up
Learnable, easy to use, and well received: the validated numbers answer the safety case laid out in the background.
<1
average glances down per task, once the jog/toggle is learned
93%
task success rate, matching the current production climate system's usability benchmark
Top 25%
UEQ benchmark reached for "exciting" and "inventive" in subjective ratings
Discovery
- The onscreen tooltip meaningfully improved discovery: most participants who saw it understood the interaction immediately
- Some still missed it while focused on the touchscreen for other tasks
Hard Button Acceptance
- The hard Climate button tested as an acceptable home for secondary functions like recirculation
- Participants looked for a soft button first, but accepted the hard button once they found it